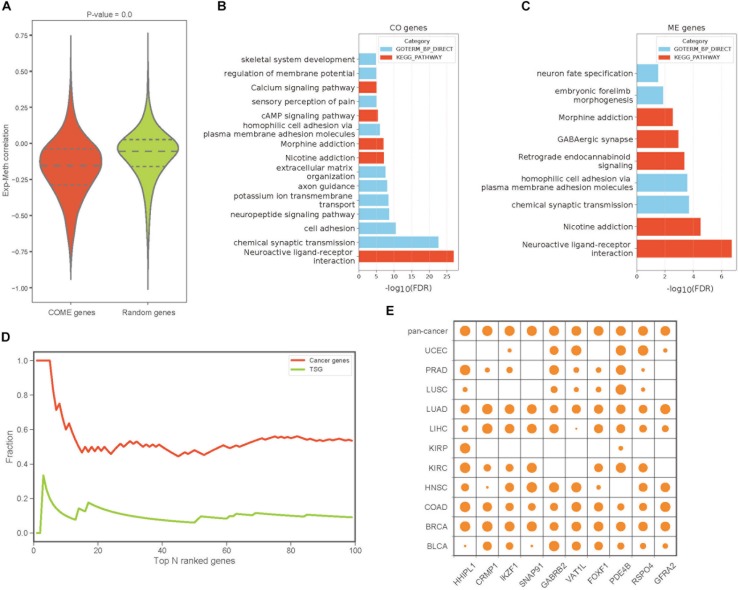
FIGURE 2.
The features and functions of gene pairs in COME events. (A) Box plot of Pearson’s correlation coefficient between gene expression and DNA methylation for the genes involved in COME events compared with that of random genes set (p-value was calculated by independent Student’s t-test). (B,C) Enriched KEGG pathways and biological processes for the genes involved in CO and ME events (DAVID online web server). (D) Fraction of cancer genes and tumor suppressor genes (TSG) against the top N genes ranked by the degree in pan-cancer network. (E) Degree distribution of top 10 genes in pan-cancer network for each cancer and pan-cancer.

