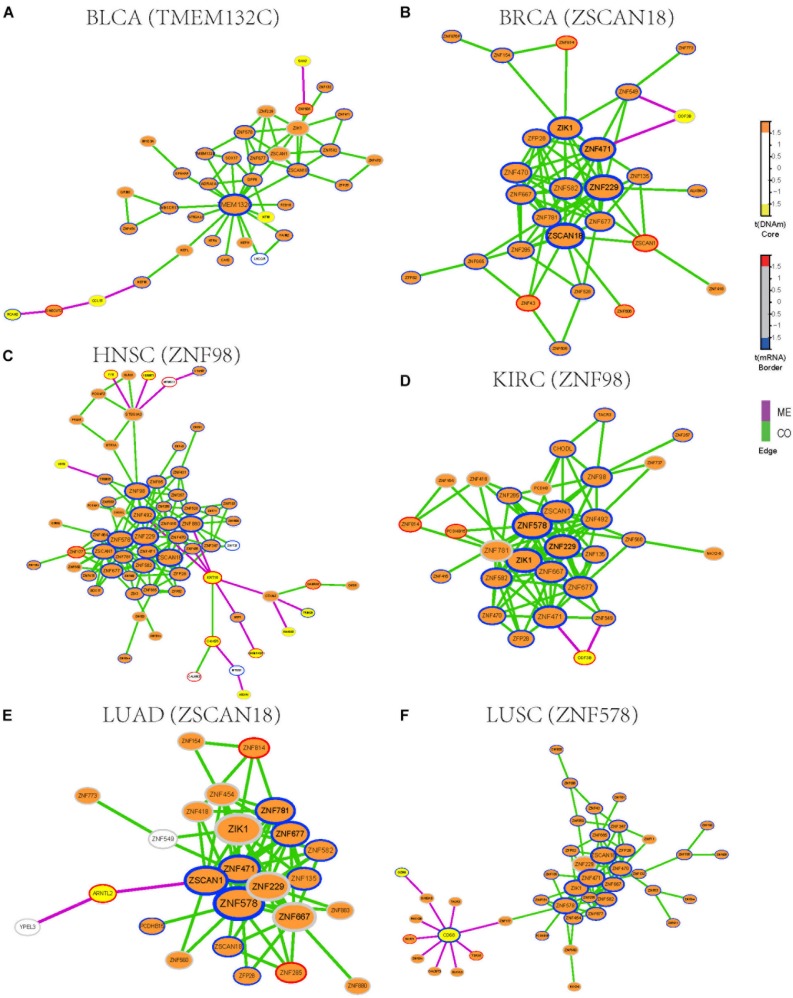
FIGURE 3.
Functional epigenetic modules identified from CO and ME network. The color of core indicate significant DNA methylation changes, color of border represent significant gene expression changes, edges represent COME events between two genes, and edge color indicates different event type (co-occurrence or mutual exclusivity). (A–F) Functional epigenetic modules identified from corresponding cancer type.

