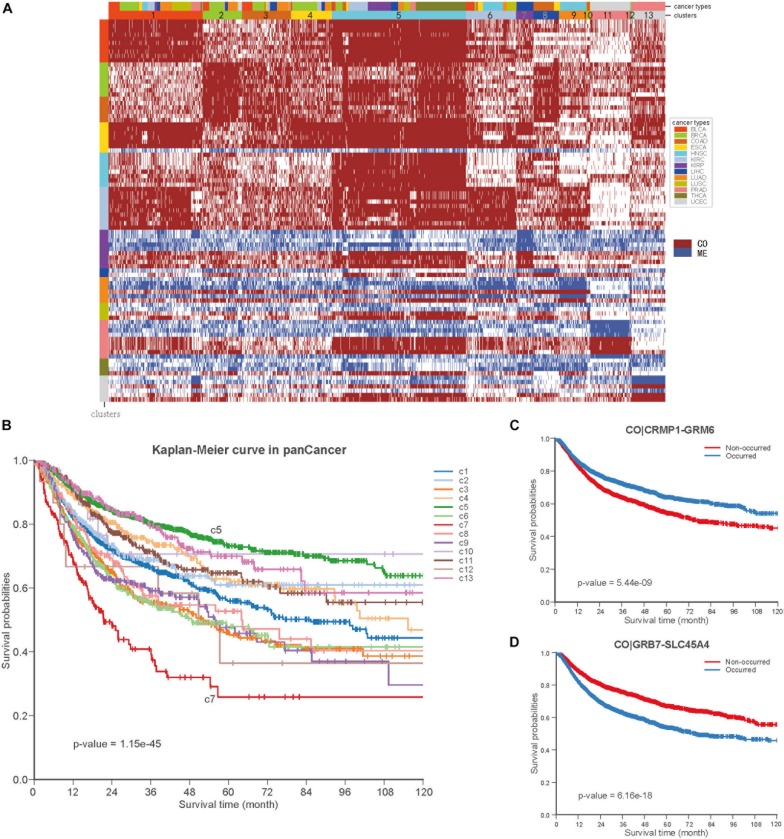
FIGURE 6.
Co-occurrence and mutual exclusive events contribute to prognosis of pan-cancer. (A) Clustering heatmap based on top 15 enriched COME events in 13 clusters. The clusters are denoted by number and color in the second bar, and tissue of origin specified in the first color bar. The color in the left identified top 15 COME pairs significantly enriched in corresponding cluster. (B) Kaplan-Meier plot for the PFI of 13 clusters identified in pan-cancer. (C,D) Kaplan-Meier plot of PFI for co-methylation event of CRMP1-GRM6 and GRB7-SLC45A4 in pan-cancer, respect.

