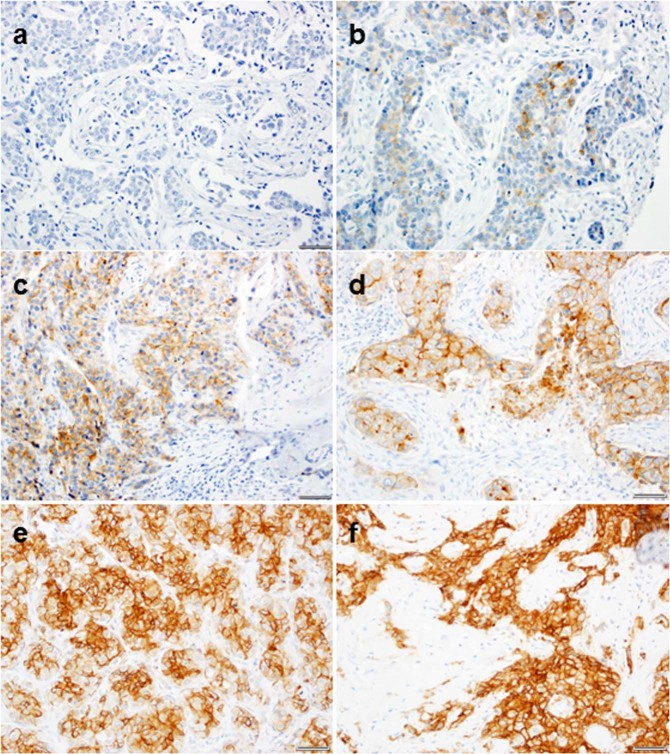
Fig. 1. Representative FRα staining of triple negative breast tumors (20×).
Membrane staining was scored as negative (0), weak (1+), moderate (2+), and strong (3+). The percent of cells within each tissue core stained at each intensity were recorded to calculate an H-score for each sample. The H-score for staining each sample was defined as: H-score = 0* (% at 0) + 1* (% at 1+) + 2* (% at 2+) + 3* (% at 3+). a H-score = 0: (3 × 0 + 2 × 0 + 3 × 0), b H-score = 50: (3 × 0 + 2 × 0 + 1 × 50), c H-score = 120: (3 × 0 + 2 × 20 + 1 × 80), d H-score = 140: (3 × 0 + 2 × 40 + 1 × 60), e H-score = 200: (3 × 20 + 2 × 60 + 1 × 20), f H-score = 300: (3 × 100 + 2 × 0 + 1 × 0). Scale bar is 50 µm.

