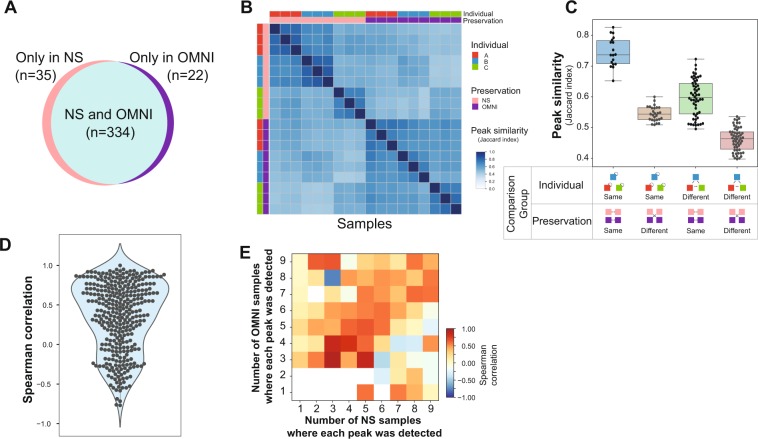
Figure 5.
NS vs. OMNI peaks. (A) Number of metabolite peaks detected in the NS and OMNI samples. (B) Degrees of peaks commonly detected in the samples, measured by the Jaccard index. (C) Comparison of the Jaccard index according to individual and preservation condition. (D) Spearman correlation coefficients of peak intensities between the NS and OMNI samples. (E) Average Spearman correlation of peak intensities between NS and OMNI samples according to the numbers of NS and OMNI samples where a peak was detected.

