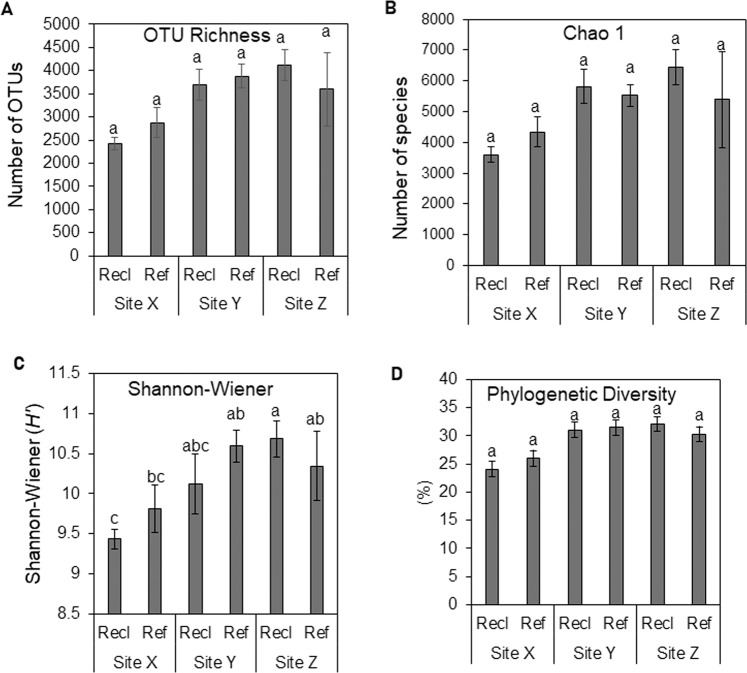
Figure 1.
16S rRNA-based OTU diversity indices. (A) OTU richness. (B) Chao 1 richness estimate. (C) Shannon-Wiener index of diversity. (D) Phylogenetic diversity based on PD whole tree. Values with different superscript letters are significantly different (Wald chi-square test, P < 0.05) based on the interaction effect in a mixed linear model. The main effect “site” is significant (Wald chi-square test, P < 0.05) for OTU richness, Chao1 and phylogenetic diversity. Differences between reference and reclamation area (pair-wise comparison) for each site is not significant (Mann-Whitney U, Test, P < 0.05).

