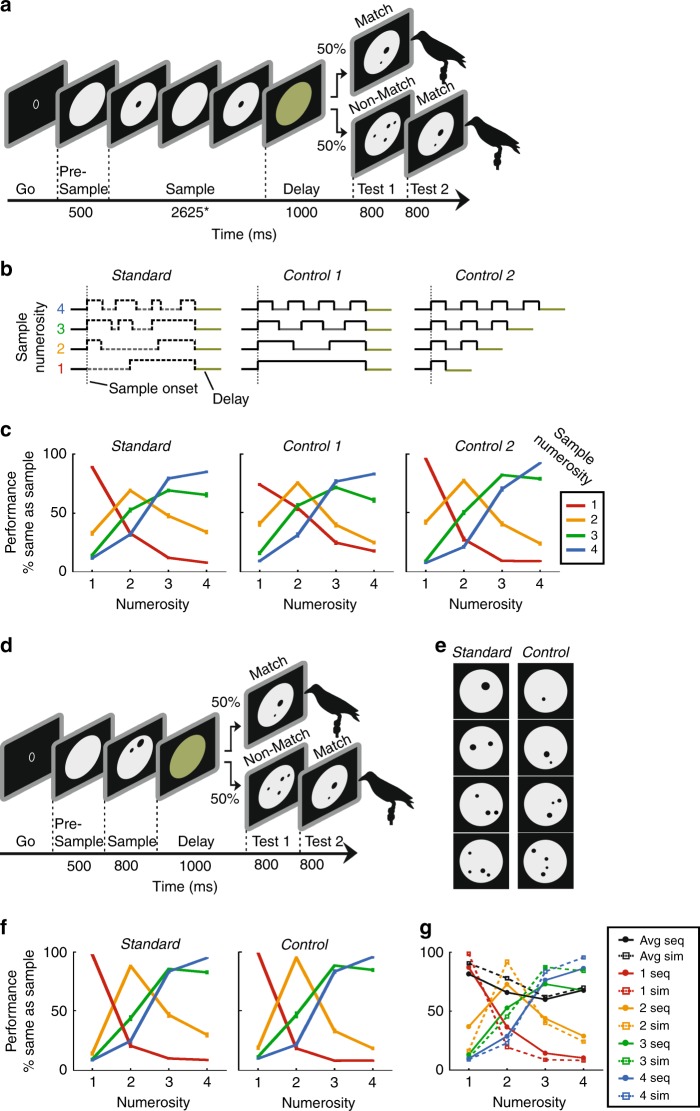
Fig. 1. Task and behavioral performance.
a Sequential delayed match-to-numerosity task. A trial starts when the crow enters the light barrier. In this presentation format, the sample numerosity is presented one item at a time, interleaved by pauses. Match and Non-match trials occur with equal probability. The crow has to respond by leaving the light barrier, when sample and test numerosity are equal. b Temporal structure of standard and control trials in the sequential format followed by a 1-s delay. In standard trials, item and pause duration are randomly generated anew for each trial, illustrated by the dashed lines. As constraint, the entire sample duration must add to 2625 ms and item and pause duration must at least be 300 ms long. In temporal control 1 (“equal variance”), item and pause durations are kept constant within each numerosity but decrease across numerosity, with the overall sample duration kept constant. In control 2 (“equal item duration”), items and pauses have the same durations across numerosities, while the duration of the sample period increased with numerosity. c Behavioral performance separately for standard and control trials averaged over both crows (error bars ± SEM). The graphs illustrate the probability of a crow judging the test numerosity (x-axis) as being equal to the sample (color). d Simultaneous delayed match-to-numerosity task. Similar to a, except that sample dots appear at once for 800 ms. e Example standard and control stimuli for the simultaneous presentation format. The control encompasses equal area and equal density across numerosities. Standard stimuli appear as test displays in the sequential presentaion format as well. f Behavioral performance for standard and control trials averaged over both crows in the simultaneous presentation format; layout as in c. g Performance functions of both crows averaged across standard and control conditions for sequential (solid lines) and simultaneous presentation formats (dotted lines). Average percent correct performance per numerosity is depicted by black lines. All error bars indicate ± SEM.

