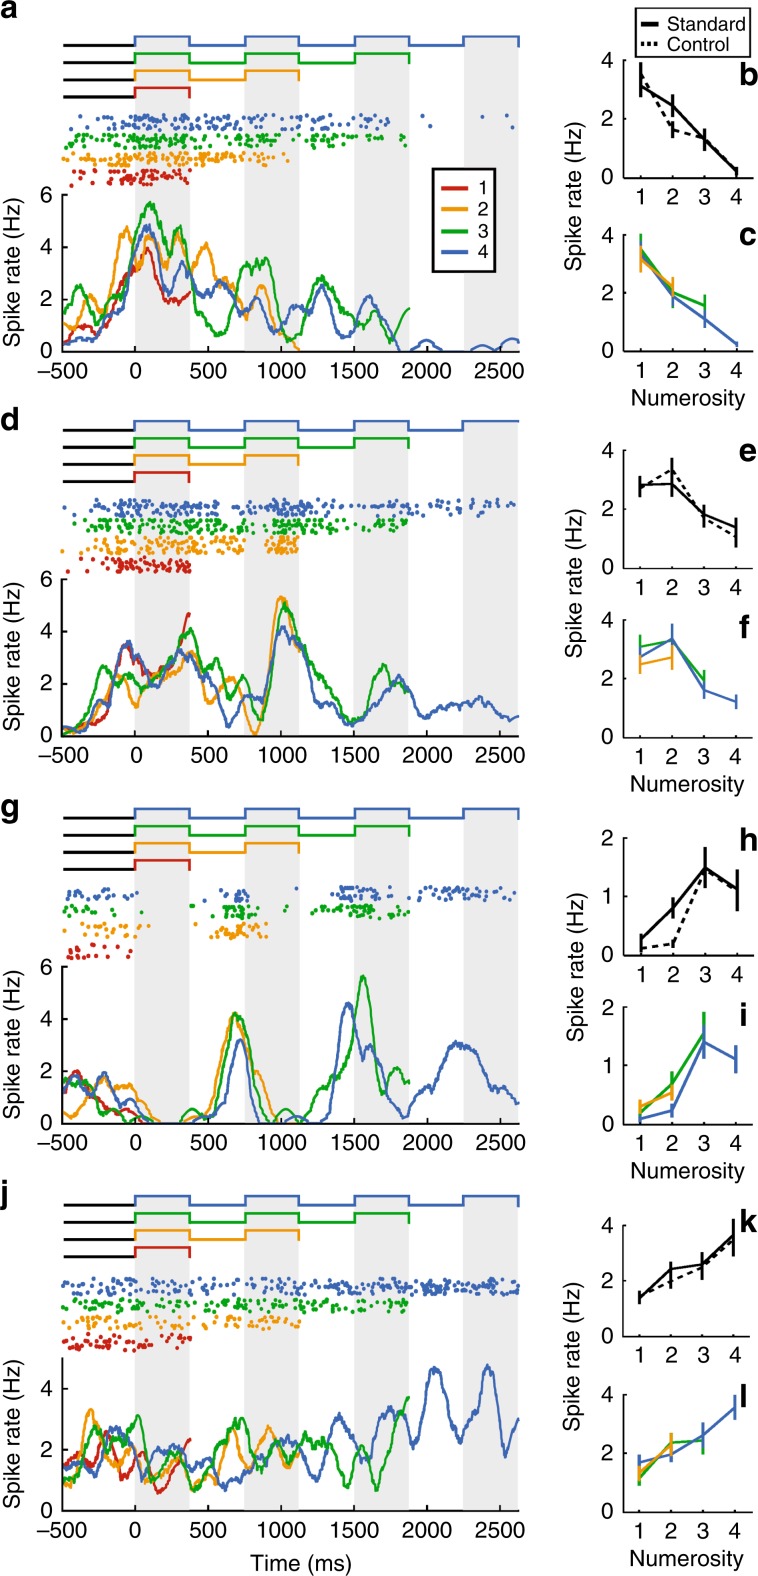
Fig. 2. Neuronal responses to numerosity during the sample period.
a–l Single-neuron responses during sample presentation to the sequential presentation format. The three depicted example neurons preferred numerosities 1 (a), 2 (d), 3 (g), and 4 (f). Big panels: neuronal activity over the course of sample presentation during sequential control 2 trials. Top: dot-raster histogram, where dots represent action potentials and one row = one trial. Background shading indicates item present. Sample presentation started at time point 0 ms. Bottom: Averaged spike density function. b, e, h, k Average activity of the respective neurons during standard and control trials. c, f, i, l Average activity split by final item count. All error bars indicate ± SEM.

