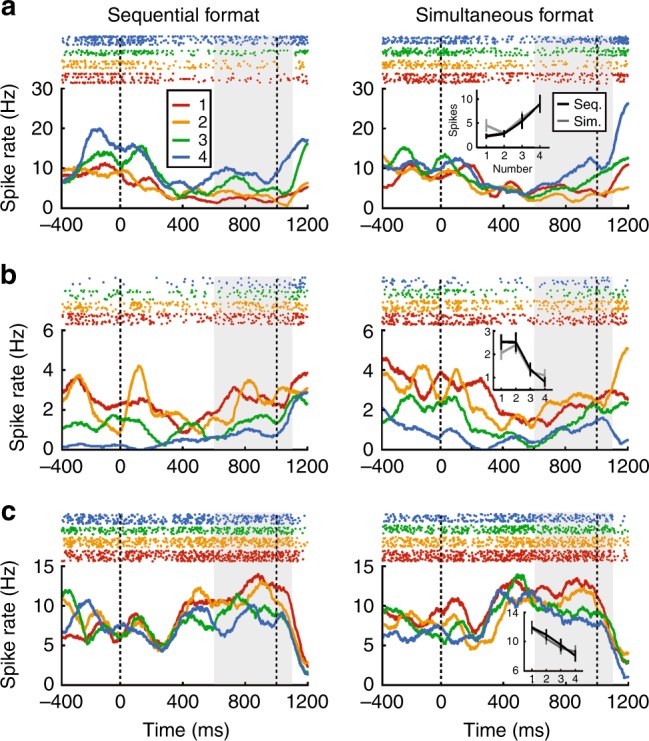
Fig. 4. Neuronal responses during the delay.

Example responses of delay neurons shown separately for sequential (left column) and simultaneous presentation formats (right column). Example neurons prefer numerosity 4 (a), 2 (b), and 1 (c). Top panels: dot-raster histogram, bottom panels: averaged spike density functions. Dashed lines indicate delay on- and offset. Gray shaded area signifies the ANOVA analysis window. Insets: Average activity of the respective neuron to numerosity during both presentation formats (error bars indicate ± SEM).
