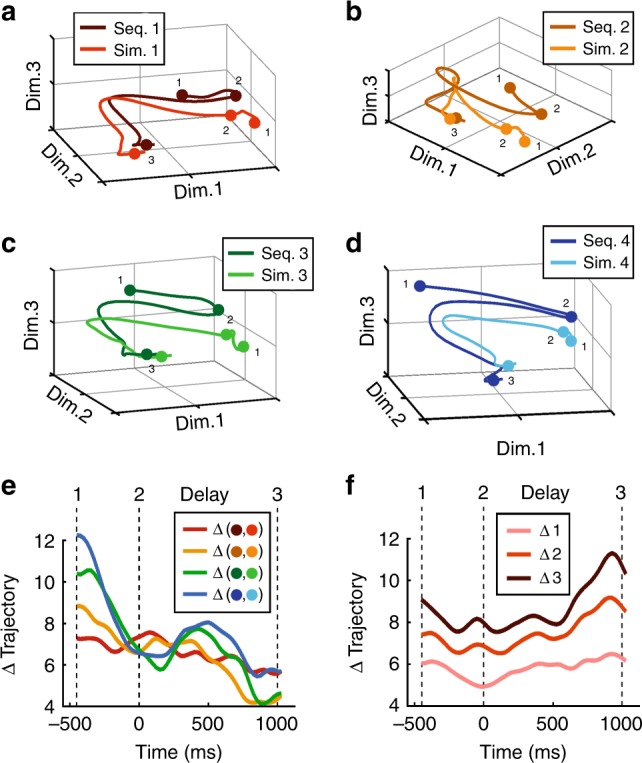
Fig. 7. State-space analysis of delay response dynamics.

a–d State-space trajectories for numerosities 1 (a), 2 (b), 3 (c), and 4 (d). Trajectories depict the route separately for sequential and simultaneous presentation formats. During onset of the last 500 ms in the sample period (1) and at delay onset (2), responses to the two formats vary from each other. Over the course of the delay, representations converge until the test comes up (3). Euclidean distances between e sequential and simultaneous trajectories separately for the four numerosities, and f between the trajectories of the different sample numerosities. Distances were averaged over pairs with the same numerical distance. Euclidean distances were calculated over all 37 dimensions. Time point 0 ms is delay onset.
