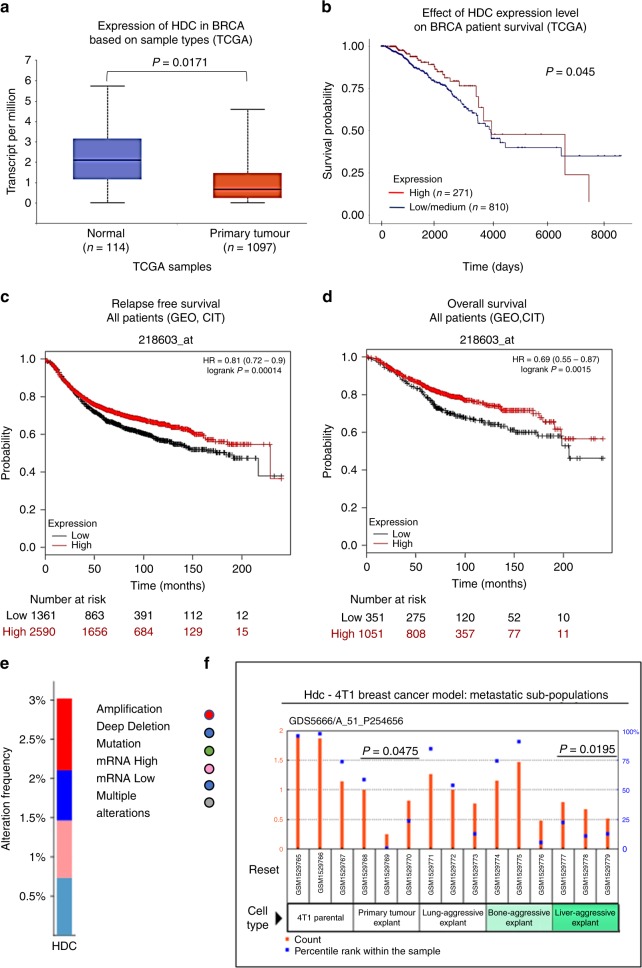
Fig. 1.
Analysis of histidine decarboxylase (HDC) expression and its association with clinical characteristics of breast cancer patients. a Boxplot generated in the UALCAN interactive web resource (http://ualcan.path.uab.edu/), shows relative expression of HDC in transcript per million units (TPM) in paired normal and primary tumour of breast-invasive carcinoma (BRCA) patients. The samples used for the analysis derived from the genomic data of The Cancer Genome Atlas (TCGA) (T test). b Kaplan–Meier plot generated in the UALCAN with TCGA data demonstrates the association of HDC expression levels with patient overall survival. Samples were categorised into two groups: high expression (red line, with TPM values above the upper quartile), and low/medium expression (blue line, with TPM values below the upper quartile), and the difference was compared by log-rank test (P < 0.05 was indicated the cutoff value). c, d Kaplan–Meier plots generated in the portal web Kaplan–Meier Plotter (http://kmplot.com/analysis/) show the association of HDC expression levels with (c) patient relapse-free survival and (d) patient overall survival. The samples used for the analysis derived from the Gene Expression Omnibus (GEO) and the “Cartes d’Identité des Tumeurs (CIT)” breast cancer (BRCA) datasets. Red line: patients with expression levels above the median; black line: patients with expression levels below the median. The two patient cohorts are compared by a Kaplan–Meier survival plot, and the hazard ratio with 95% confidence intervals and log-rank P-value are calculated. Additional clinical parameters are displayed in Supplementary Table 2. e Genomic alteration frequencies of HDC in breast cancer patients. The analysis was performed by using CBioPortal database (www.cbioportal.org). f GSE62598 microarray dataset from the GEO database was used to evaluate HDC expression on different sources of 4T1 breast cancer model (Mann–Whitney test, P-value compared with 4T1 parental cells)

