Fig. 3.
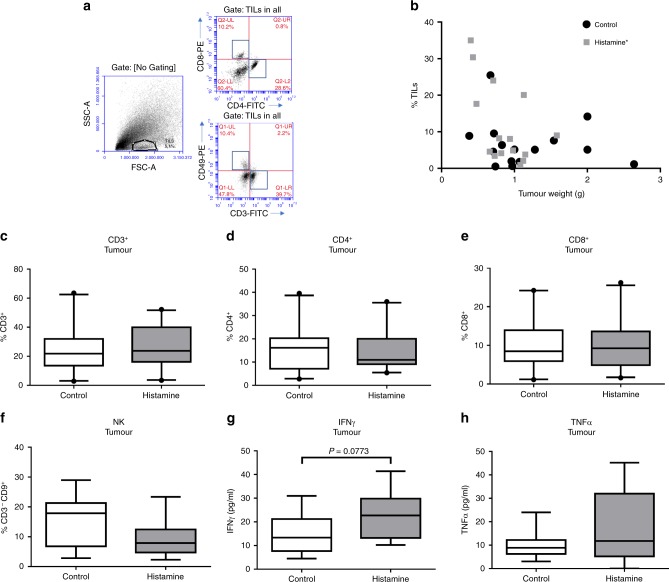
Distribution of tumour-infiltrating immune cell subsets in control and histamine-treated mice. Mice bearing 4T1 tumours were treated with saline (control) or histamine (5 mg kg−1). a Gating scheme for the flow cytometric analysis of tumour-infiltrating lymphocytes (TILs). Representative data of single-cell suspensions from enzymatically dissociated tumours, labelled with antibodies according to procedures described in the “Methods” section. Numbers represent the percentage of cells in the respective gate. b The percentage of TILs (% TILs), determined by flow cytometric analysis of forward vs. side scatter, was correlated with tumour weight for each experimental group. Spearman correlation for control mice (P > 0.05; n = 15) and mice treated with histamine (correlation coefficient, r: –0.4821, *P < 0.05; n = 15). c–f Tumour cell suspensions were labelled with specific antibodies, and the percentage of each subset was determined within the TIL-gated population: c CD3-FITC: T lymphocyte marker (n = 20 control; n = 21 histamine), d CD4-FITC: T helper lymphocyte marker (n = 20 control; n = 21 histamine), e CD8-PE: T cytotoxic lymphocyte marker (n = 20 control; n = 21 histamine), f CD49-PE and CD3-FITC: NK markers (n = 14 control; n = 14 histamine). g, h Cytokine concentrations in tumour-conditioned medium (n = 12 control; n = 10 histamine). The box plots represent the median and interquartile range for each experimental group (Mann–Whitney test)

