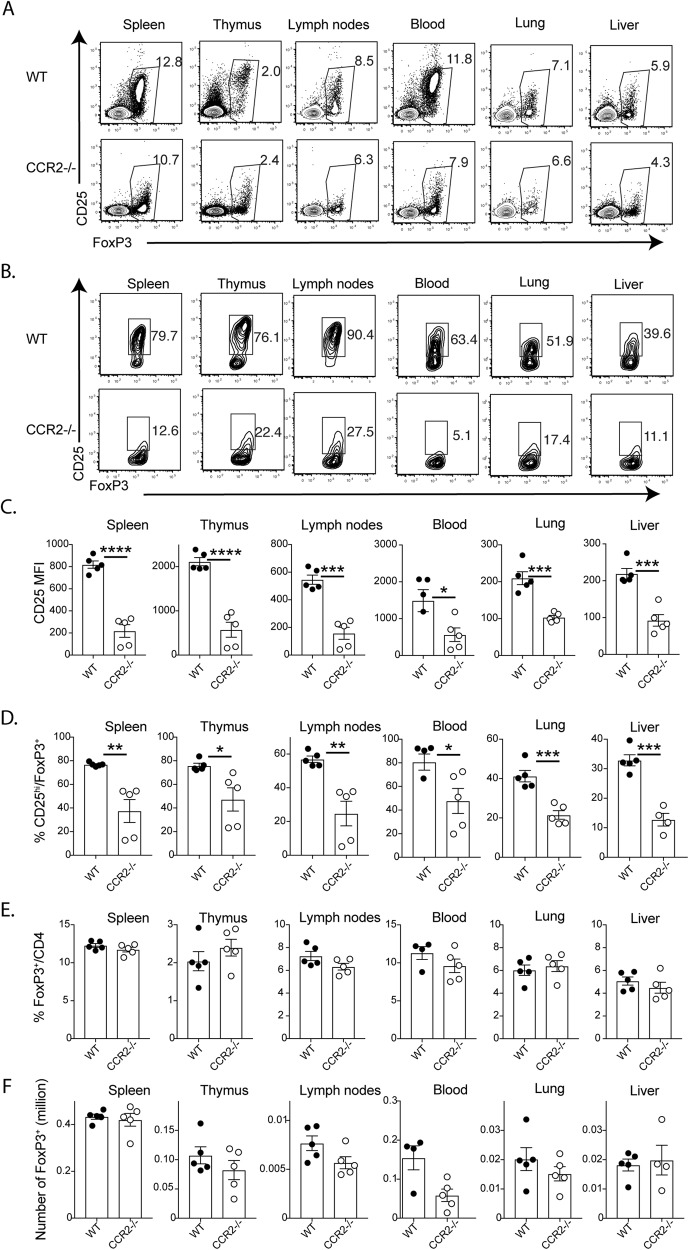
Fig. 1.
CCR2 deficiency leads to reduced CD25 expression and loss of CD25+ FoxP3+ Tregs. Tissues were harvested from WT and CCR2−/− mice (five each; 9-week-old male mice) for analysis. a Representative plots showing the expression of FoxP3 and CD25 on gated CD4+ T cells from different tissues. b Representative plots showing the expression of FoxP3 and CD25 on gated FoxP3+CD4+ T cells from different tissues. c Bar graphs showing the levels of CD25 expression (as the mean fluorescence index (MFI)) by gated FoxP3+ T cells. d Bar graphs showing the percentages of cells with high CD25 expression among FoxP3+ T cells. e, f. Bar graphs showing the percentages and numbers of FoxP3+ cells. The data shown are the mean ± SEM of four individual animals. All data were analyzed using two-tailed Student’s t test. *P < 0.05, **P < 0.01, ***P < 0.001, and ****P<0.0001. Five repeated experiments showed similar results

