Fig. 3.
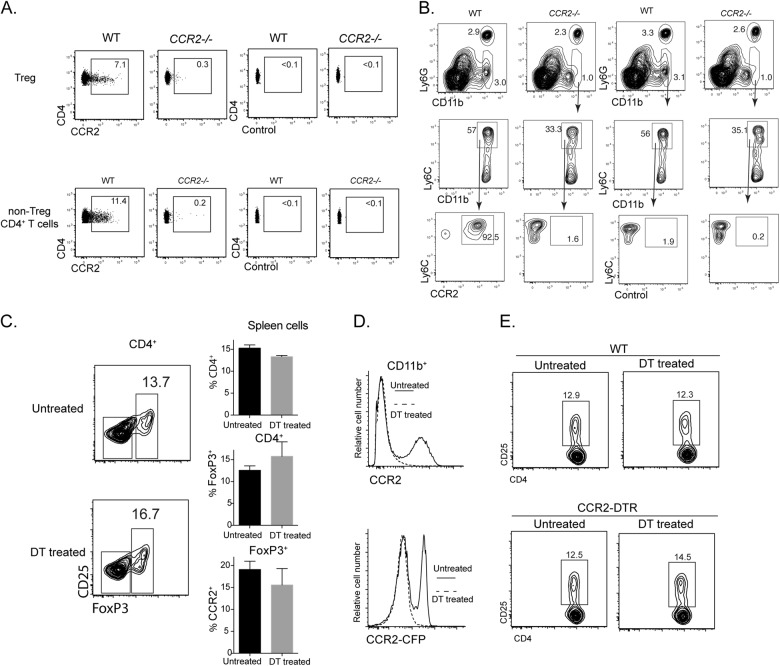
Deletion of CCR2 monocytes/moDCs has little impact on Tregs. a, b CCR2 expression by T cells and Ly6C+CD11b+ monocytes. Spleen cells from WT mice and CCR2−/− mice were analyzed for CCR2 expression with an anti-CCR2 Ab and an isotype control. a Plots showing CCR2 expression by Tregs and non-Treg CD4+ T cells from WT mice and CCR2−/− mice. b Plots showing CCR2 expression by gated Ly6C+CD11b+ monocytes. c−e CCR2-DTR mice were either untreated or treated with 200 ng DT/dose every second day over 7 days. Spleens were harvested 1 day after the last dose. Spleen cells were analyzed for T cells and CD11b+ cells. c The contour plots show the distribution of FoxP3 in gated spleen CD4+ T cells with or without DT treatment. The bar graphs show the percentages of the indicated T-cell populations; >4 similar experiments were performed with similar results. d Histograms showing the expression of surface CCR2 (by Ab) and CCR2 reporter (cyan fluorescent protein, CFP) by CD11b+ spleen cells from DT-treated and untreated mice. DT-treated mice (dotted lines) lost CCR2+CD11b+ cells. e Mixed bone marrow chimeras of WT and CCR2-DTR donors were either untreated or treated with 200 ng DT/dose every second day over 7 days. Spleen cells were analyzed for CD25 expression

