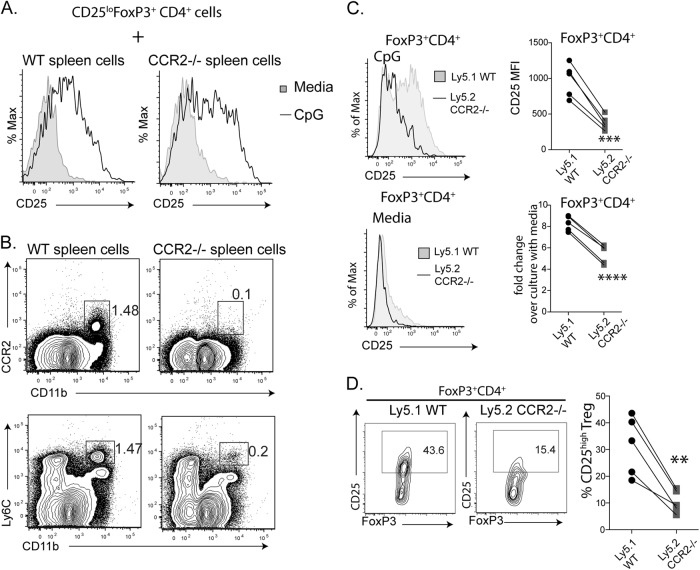
Fig. 6.
CpG-stimulated CD25 upregulation requires CCR2 expression by FoxP3+ cells. a, b CD25loFoxP3+ cells were purified from Foxp3 reporter mice. CD25loFoxP3+ cells (50,000 cells per well) were cocultured with 2×10⁵ spleen cells from WT or CCR2−/− mice in the presence or absence of CpG (1 μM) in a 96-well round-bottom plate for 20 h. The expression of CD25 by FoxP3+ cells was evaluated. The histograms (a) show CD25 expression by FoxP3+ cells with WT spleen cells or CCR2−/− spleen cells. The FACS plots (b) show the differences in myeloid cells between WT and CCR2−/− spleen cells. c, d Spleen cells from five individual chimeric mice were cultured with or without CpG for 20 h. The histograms (c) show the expression of CD25 by FoxP3+ cells cultured with or without CpG. The MFI of CD25 expression is shown for CpG-stimulated WT and CCR2−/− FoxP3+ Tregs (top), and the fold changes in CD25 expression compared to that of unstimulated Tregs are also shown (bottom). The lines indicate data from the same mouse. **P < 0.01, ***P < 0.001, and ****P < 0.0001 by paired t tests. The data are from one of three similar experiments

