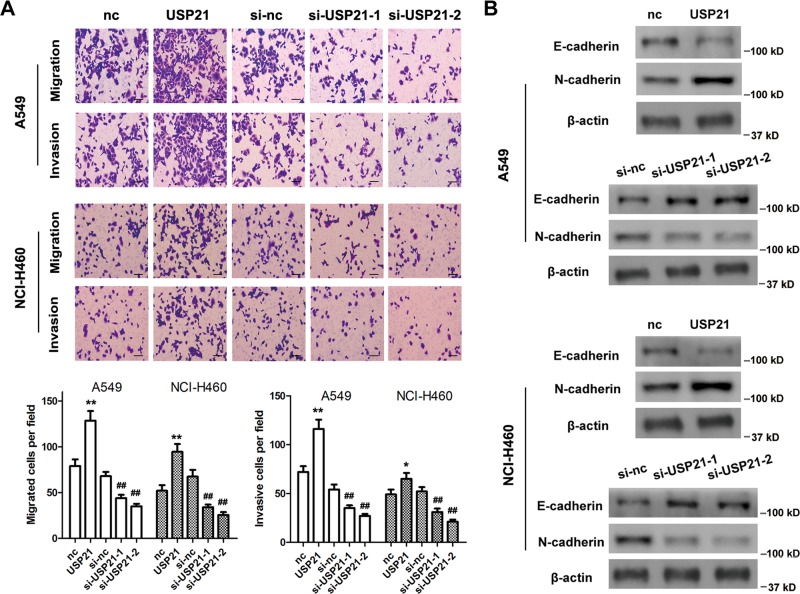
Fig. 3. USP21 promotes NSCLC cell migration and invasion.
a Migration and invasion of A549 and NCI-H460 cells after overexpression or silencing of USP21. Representative images (upper panel) and quantifications (lower panel) are shown. Scale bar = 100 μm. Error bars: mean ± SD. n = 3. *p < 0.05, **p < 0.01 vs. the normal control (nc) group. ##p < 0.01 vs. si-nc. b E-cadherin and N-cadherin western blot analyses after overexpression or silencing of USP21. β-Actin was used as an internal control.

