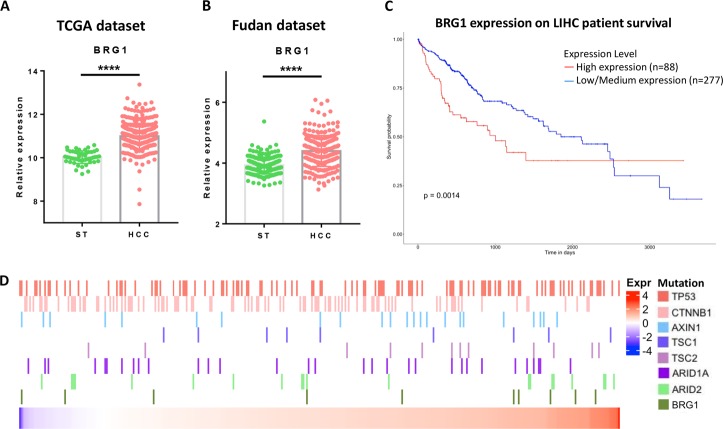
Fig. 1. BRG1 expression, mutation, and survival analysis in human data sets.
a Scatter-bar plot of BRG1 mRNA expression in TCGA LIHC data set. b Scatter-bar plot of BRG1 mRNA expression in Fudan data set. c Kaplan–Meier survival plot from UALCAN using TCGA LIHC data set. d Heatmap of BRG1 mRNA expression in TCGA LIHC data set with multiple mutation status of well-known oncogenes in HCC. ST surrounding tissue, HCC hepatocellular carcinoma; ****p < 0.0001.

