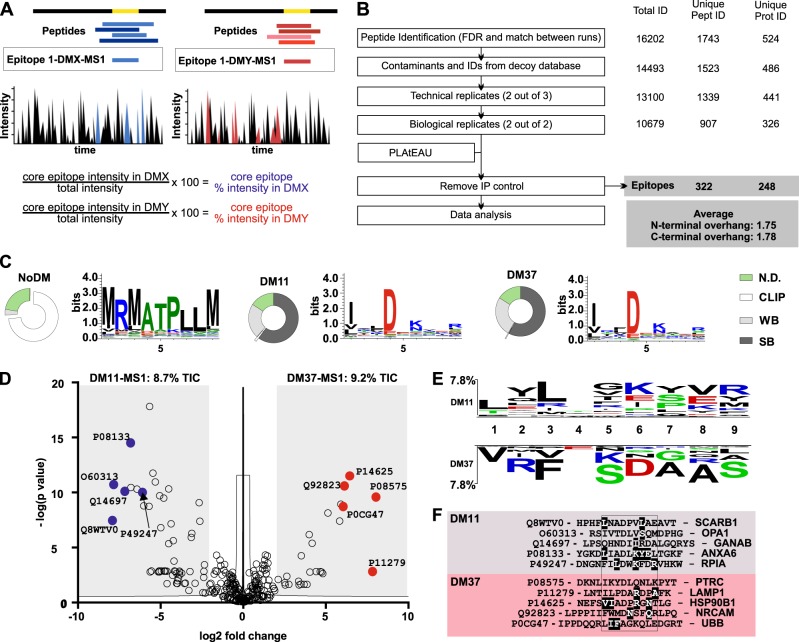
Fig. 4.
Influence of DM on the immunopeptidome presented by HLA-DR molecules. a Schematic representation of MHCII immunopeptidome analysis using the PLAtEAU algorithm. PLAtEAU aligns the peptides eluted from MHCII molecules under each condition to their protein sources (black and gray) and defines a consensus epitope that spans the maximum amino acid sequence from any series of nested peptides. During this process, the algorithm also takes into account the MS1 intensities of individual peptides (color intensity) to derive a defined relative intensity for each consensus epitope. The relative intensity of each epitope is calculated on a per residue basis using the MS1 intensity of each peptide and the Total Ion Current (TIC) of each condition. For two specific conditions, DMX and DMY conventional analysis focuses on the peptides, while using PLAtEAU yields epitopes with associated relative intensities (boxed) that can be used for LFQ. b Overview of the performance of the immunopeptidome analysis and the criteria applied for peptide identification and quantification. Known contaminants (included in the MaxQuant platform) and identifications from the decoy database are initially filtered out. Two extra filters are applied, one for technical replication and another for biological replication. The resulting dataset is subsequently used as the input for our recently described algorithm, PLAtEAU56. Epitopes found in the IP control samples are removed. Number of identifications, peptides, and protein sources are shown on the right side. c Features of the immunopeptidome isolated from the T2.DR3-NoDM (left), -DM11 (middle) and -DM37 (right) cell lines. For each dataset, we retrieved the consensus epitopes and their corresponding relative intensities. We used these lists of consensus epitopes to predict binding affinities and cores (NetMHCIIpan). Weighing the presence of each consensus epitope (relative intensity) allows us to define the relative abundances of strong binders (SB), weak binders (WB, including CLIP, highlighted), and those for which no affinity is predicted (N.D. not defined). The results are shown as donut charts. The same weighted consensus epitope list is used to define Seqlogos for each condition. d Volcano plot depicting the log2-fold intensity difference between the epitopes identified for DM37 and DM11 vs. the –log(P) of the differences. Representative examples of epitopes enriched for each condition are shown, indicating the UniProt accession code. e Two-sample logo analysis of the weighted binding cores for each condition (DM11 or DM37). The predicted position for each residue within the binding groove of DR3 molecules is shown, ranging from P1(1) to P9.(9) Only significant differences (p < 0.05) are shown. Residues shown on the upper or the lower part indicate those that were preferentially found in the pool of peptides eluted from DM11 or DM37, respectively. f Representative examples of epitopes enriched for each condition (d). Predicted binding cores are aligned and contained within a box. UniProt accession codes for the protein sources are indicated, as are the gene names. Highlighted residues are also found in the two-sample logo analysis

