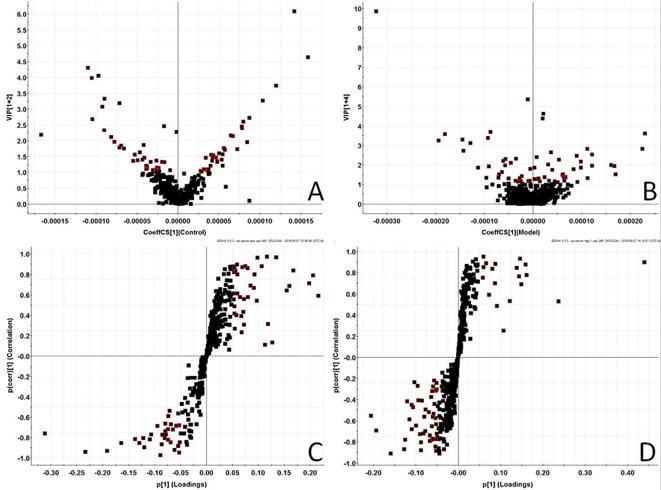
Figure 3.
Metabolomics profiling of the control group and model group. VIP-plot of serum profile of control group and model group scanned by OPLS-DA analysis inpositive ion mode. (B) VIP-plot of serum profile of control group and model group scanned by OPLS-DA analysis innegative ion mode. (C) S-plot of serum profile of control group and model group scanned by OPLS-DA analysis in positive ion mode. (D) S-plot of serum profile of control group and model group scanned by OPLS-DA analysis in negative ion mode.

