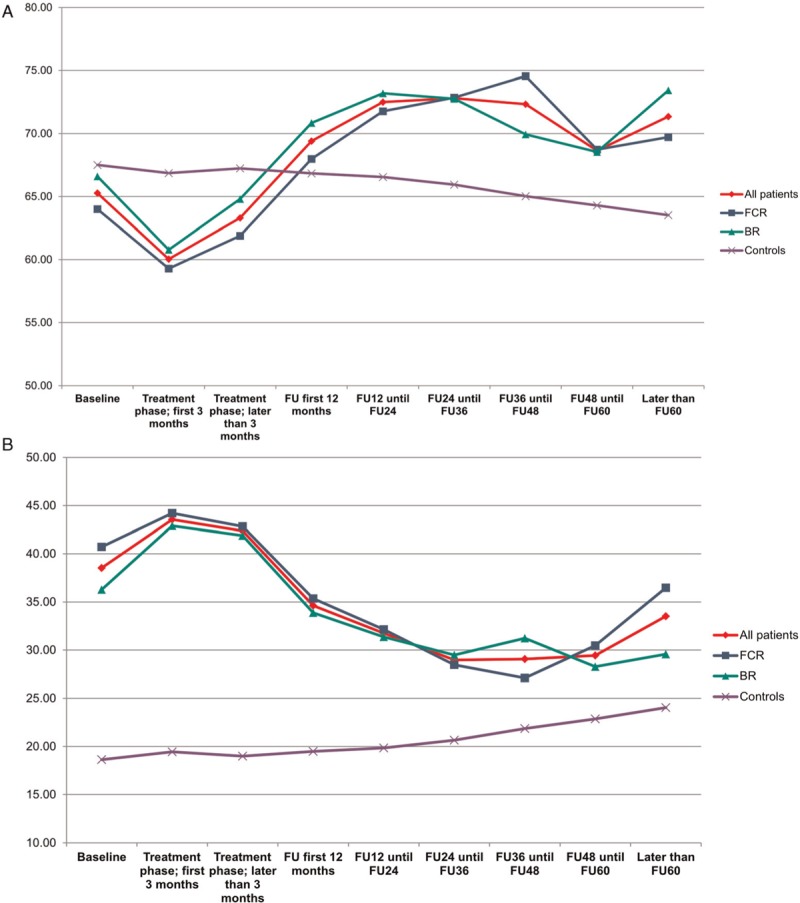
Figure 4.

(A) Global health status in all patients vs healthy controls (B) fatigue in all patients vs healthy controls (C) global health status in both treatment arms and different age groups (D) fatigue in both treatment arms and different age groups.
