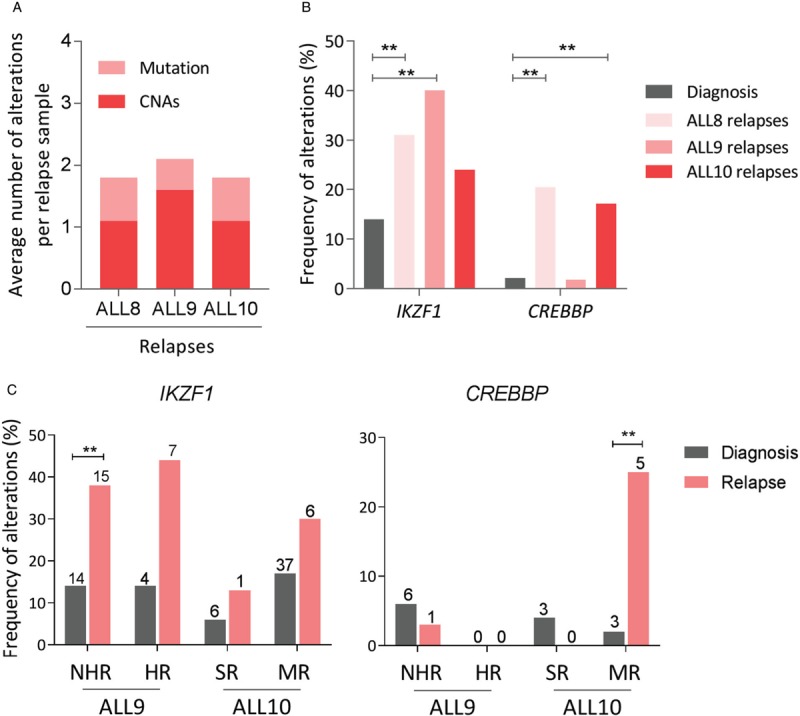
Figure 2.

Frequency of genetic alterations in relapse samples classified by upfront treatment protocols. (A) Average number of mutations and CNAs in relapse samples treated by upfront protocols, ALL8, ALL9, and ALL10. (B) Comparison of affected gene frequency between diagnosis and relapse. Only genes showing significant differences between diagnosis and total relapse are depicted. Details of all genes are presented in Table S6, S10. (C) Comparison of affected frequency in IKZF1 and CREBBP between diagnosis and relapse among upfront risk-stratified treatment groups. The number of samples affected is indicated on the top of the bar. Details of the comparison are presented in Table S9, S10. Significant difference (p < 0.01) is indicated by double asterisks.
