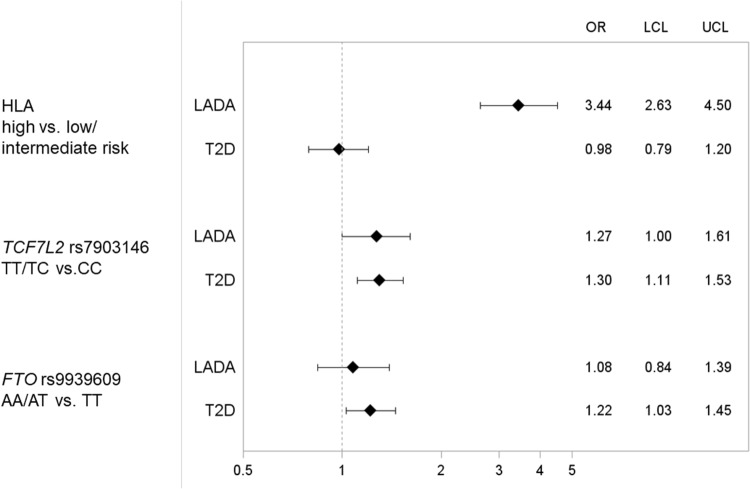
Fig. 1.
OR with 95% CI of incident LADA and type 2 diabetes in relation to genotypes of HLA, TCF7L2, and FTO. The model is adjusted for age and sex. Distribution of patients and controls with each genotype was as follows: LADA HLA low/intermediate risk n = 149, high risk n = 235; T2D HLA low/intermediate risk n = 851, high risk n = 389; controls HLA low/intermediate risk n = 601, high risk n = 278; LADA TCF7L2 CC n = 184, TT/TC n = 200; T2D TCF7L2 CC n = 587, TT/TC n = 655; controls TCF7L2 CC n = 823, TT/TC n = 707; LADA FTO TT n = 124, AA/AT n = 239; T2D FTO TT n = 392, AA/AT n = 814; controls FTO TT n = 548, AA/AT n = 983

