
Fig. 3.
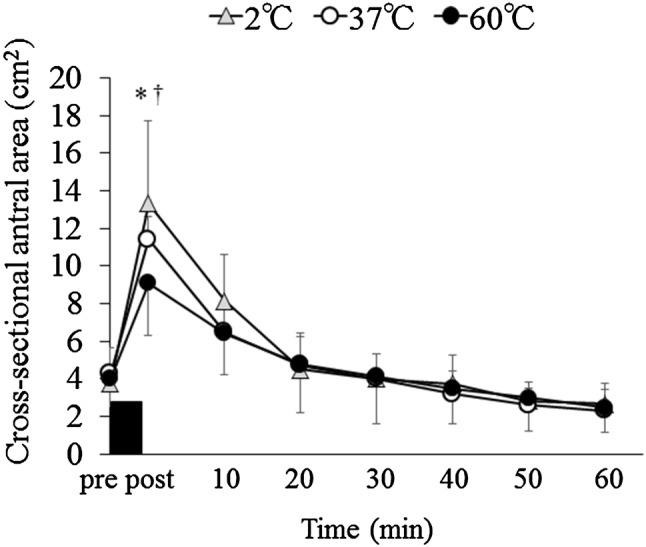
Cross-sectional gastric antral area before and after consuming water (500 mL) at 2 °C, 37 °C and 60 °C. Data are mean ± SD. Black rectangle indicates consuming water in 5 min. Data were analyzed using two-factor ANOVA followed by a Bonferroni multiple-comparison test. There was a significant main effect of time (p < 0.001) and trial–time interaction (p = 0.020). *Significantly different between the 2 °C and 60 °C trials (p < 0.05). †Significantly different between the 37 °C and 60 °C trials (p < 0.05)