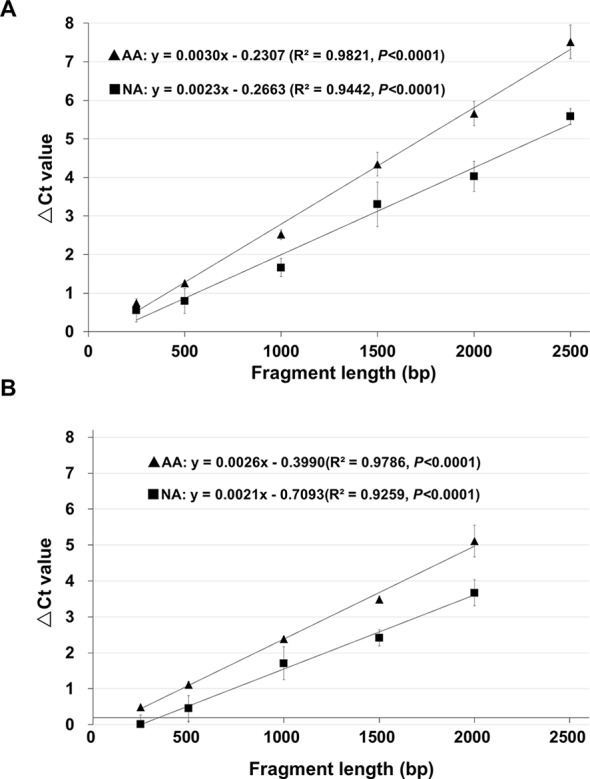
Figure 3.

The relationship between ΔCt value and cDNA fragment size analyzed using the same genes. cDNAs of control (100% germination), AA (artificially aged, 0.5% germination) and NA (naturally aged, 0.5% germination) seeds were used to analyze different fragments of the B16 and B20 genes. Each ΔCt value was based on three biological repeats. (A) Correlation between the ΔCt value and cDNA fragment length for six cDNA fragments (starting from the STOP codon) of the gene B16. (B) Correlation between the ΔCt value and cDNA fragment length for five cDNA fragments (starting from the STOP codon) of the gene B20. Linear regressions were obtained with Microsoft Excel 2010 and all have a P <0.0001. ▲: ΔCt values for AA seeds, ▪: ΔCt values for NA seeds.
