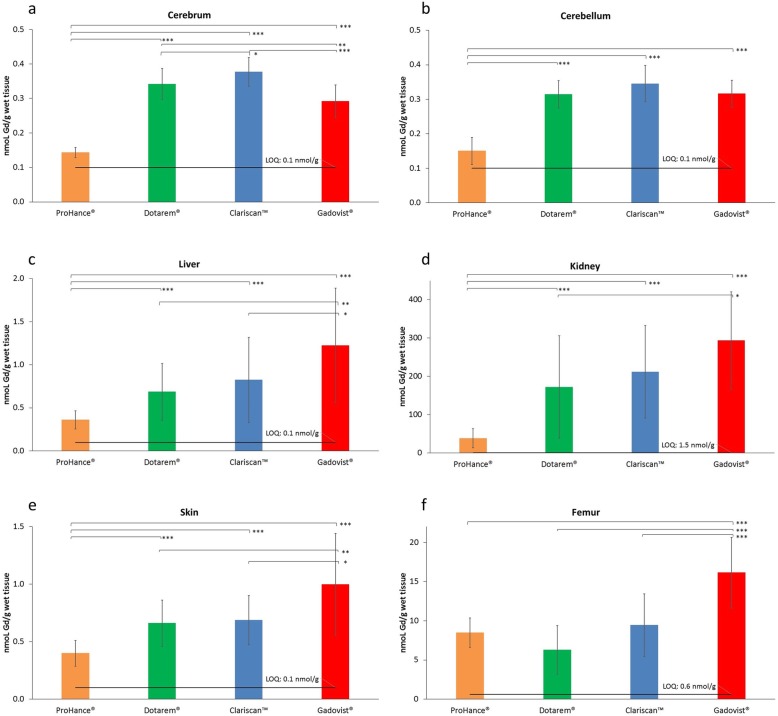
Fig. 1.
Gadolinium content in the (a) cerebrum, (b) cerebellum, (c) liver, (d) kidney, (e) skin, and (f) femur: Mean values ± SD. The significance of differences between groups is shown as *p ≤ 0.05, **p ≤ 0.01, and ***p ≤ 0.005. Data for blood and for the control group (group A, saline) are not shown because all values were below the LOQ. The error bars represent the standard deviation of measurements within the groups (n = 15, except “Dotarem, skin” and “Gadovist, kidney” where n = 14)

