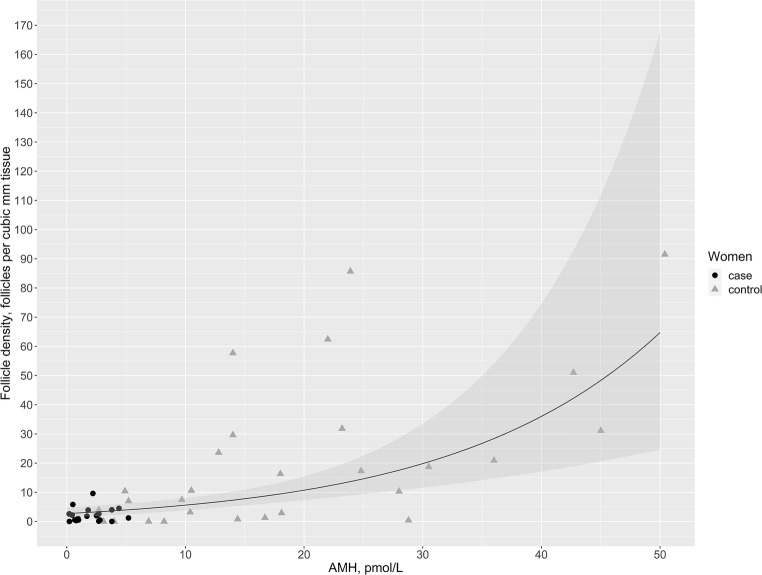
Fig. 2.
The correlation between follicle density and anti-Müllerian hormone (AMH) serum levels in both cases and controls. The black line represents the best fitted line for the estimated follicle density according to serum levels of AMH. The gray area represents the 95% confidence interval. Follicle densities from the cases (women with diminished ovarian reserve) are shown with black dots while densities from the controls are shown with gray triangles

