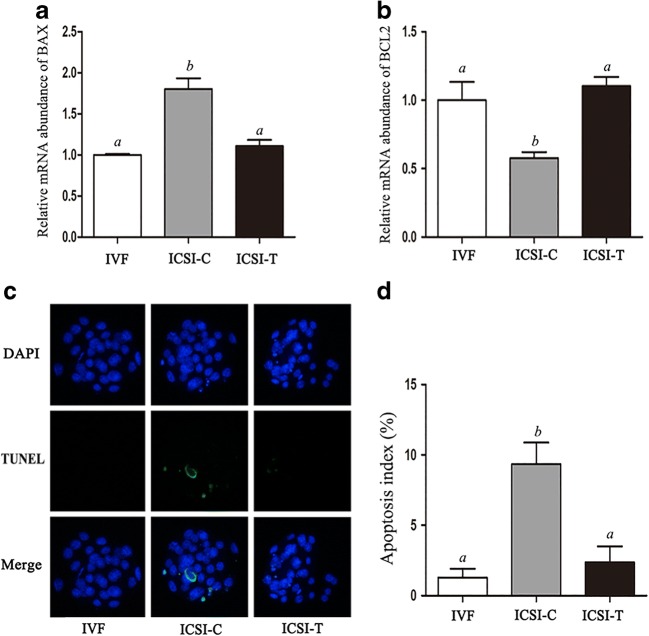
Fig. 2.
Relative mRNA expression levels of BAX and BCL2 and the apoptosis index in blastocysts. (A) Relative expression of BAX mRNA in blastocysts in each group. (B) Relative expression of BCL2 mRNA in blastocysts in each group. (C) Apoptosis was assessed by terminal deoxynucleotidyl transferase dUTP nick-end labeling (TUNEL) assay in blastocysts. Apoptotic blastomeres were detected by TUNEL (green). DNA was stained by DAPI (blue) to visualize all blastomeres. (D) Quantification of the apoptosis index of blastocysts in each group. Data are shown as the mean ± SEM. Values with different superscripts differ significantly (P < 0.05)

