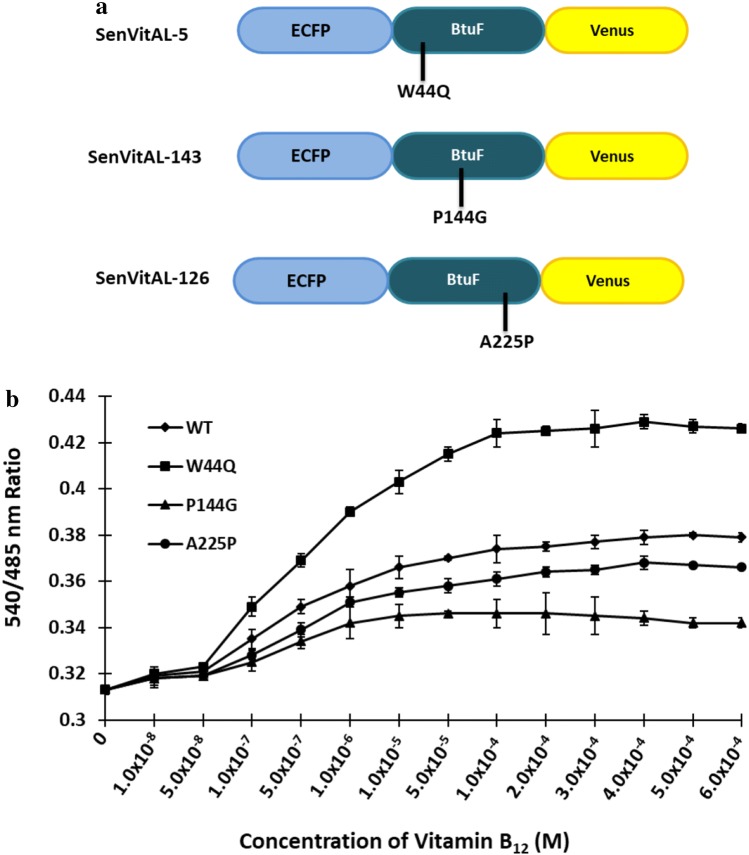
Fig. 4.
Ligand binding saturation curve of WT and affinity mutants of SenVitAL. a Design of SenVitAL variants. b Emission intensity ratio (540/485 nm) alteration was recorded in presence of varying concentrations of vitamin B12. Affinity mutants W44Q, P144G and A225P compared with the WT nanosensor. Data are means of three independent values (n = 3). Vertical bars indicate standard error

