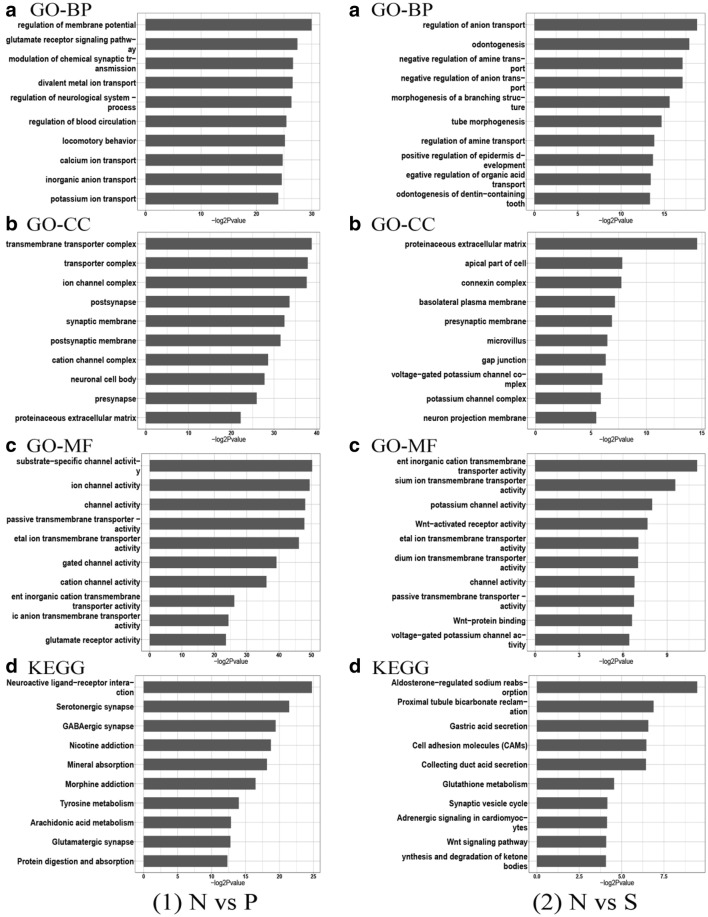
Fig. 2.
The top 10 enrichment GO (gene ontology) and KEGG pathway terms in (1) N vs P and (2) N vs S. x-axis represents negative log2 p values.
A GO analysis for biological process (BP); B GO analysis for molecular function (MF); C GO analysis for cellular components; (CC) D 10 most significant KEGG pathways

