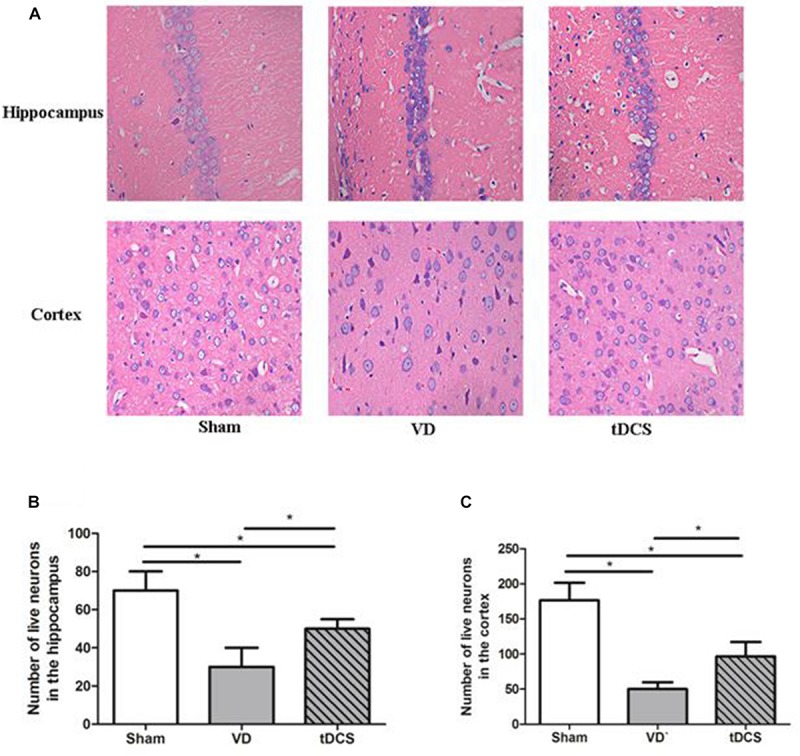
FIGURE 3.

(A) Morphological changes in the hippocampal CA1 area and cerebral cortex of rats in each group (HE staining) (×400); Quantification analysis of the numbers of live neurons in the hippocampus (B) and the cortex (C) of rats from each group (*P < 0.05).
