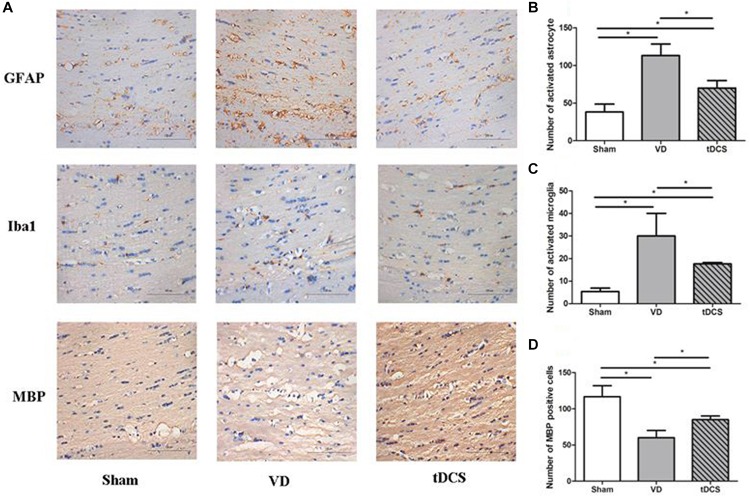
FIGURE 4.
(A) Photomicrographs of immunohistochemistry staining for GFAP, Iba1, and MBP in the corpus callosum of rats in each group (×400), scale bar: 100 μm. Quantification analysis of the number of GFAP positive (B), Iba1 positive (C), and MBP (D) positive neurons in the corpus callosum of rats from each group (n = 6 per group, three sections per rat) (*P < 0.05).

