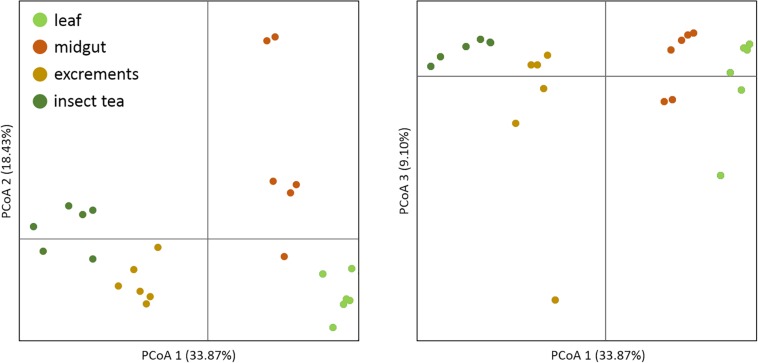
FIGURE 1.
Beta diversity assessment of different sample types. A principal coordinate analysis was conducted in order to visualize the clustering and similarity of the analyzed sample types. The three dimensions which explain the highest degree of variance were included in the visualization. Different colors of the dots indicate distinct sample types. The significance of dissimilarity between the different bacterial communities was tested with anosim in QIIME 2.

