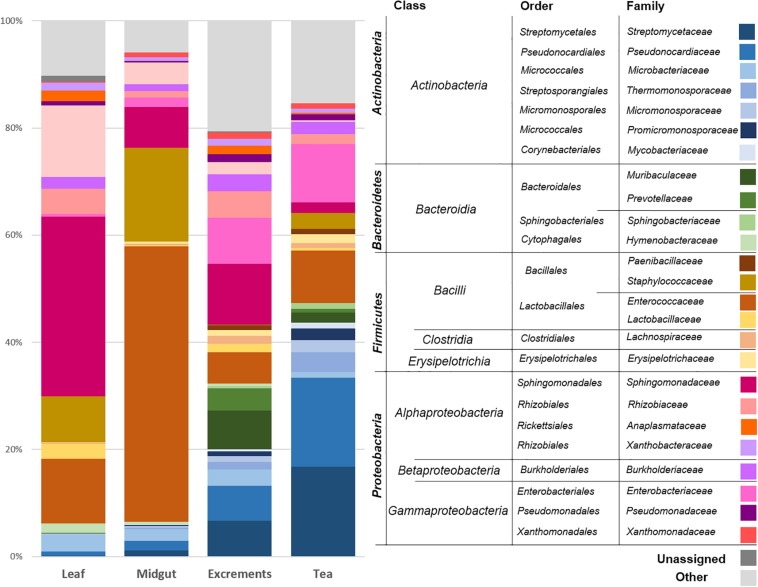
FIGURE 2.
Bacterial community structure of the different sample types. The bacterial community structure was visualized up to family level for each sample type. Taxonomic assignments at higher levels are provided and clustered in the legend. The average abundance of each taxon in six replicates for each sample type (leaf: C. paliurus leaves, midgut: P. farinalis midguts, excrements: P. farinalis excrements, tea: commercial insect tea product) is shown. All taxa with an occurrence of ≥1% were included in the legend. Taxa with a lower abundance were summarized as “other.”

