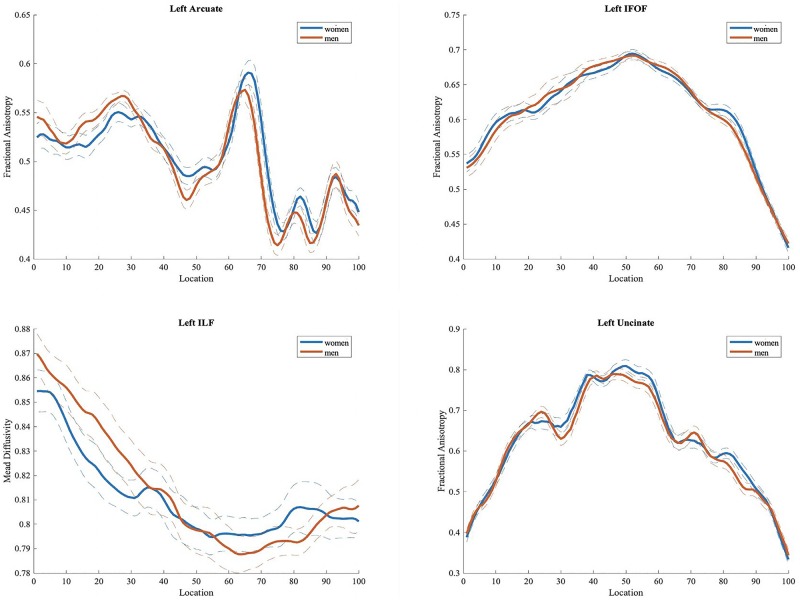
FIGURE 4.
Fractional anisotropy (FA) values in men and women for left hemisphere tracts (arcuate, inferior fronto-occipital, inferior longitudinal and uncinate fasciculi) often implicated in language processing. Plots of mean FA values are reported bin by bin for each group (women in blue and men in orange). Dotted lines represent ± 1 SD. The x-axis represents location along the length of each tract core from 1 to 100 equidistant bins. The y-axis reflects the subjects’ group mean FA values for each tract.

