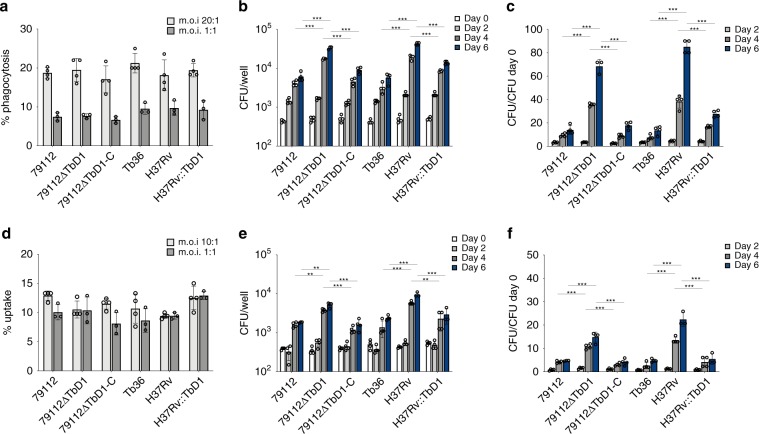
Fig. 4. Intracellular growth profiles of TbD1 WT and mutant strains in THP-1 and A549 human cell lines.
a–c Comparative analysis of the percentage of phagocytosis (a) and growth (b, c) of TbD1-intact and ΔTbD1 WT and mutant strains in human THP-1 cells. d–f Comparative analysis of the percentage of uptake (d) and growth (e–f) of TbD1-intact and ΔTbD1 WT and mutant strains in human A549 cells. For determination of the percentage of uptake, THP-1 cells were infected at m.o.i 20:1 and 1:1 (cells: bacteria), while A549 cells were infected at m.o.i 10:1 and 1:1 (cells: bacteria). The comparison of growth kinetics of different TbD1-intact and ΔTbD1 WT and complemented strains was undertaken at m.o.i 20:1 (cells:bacteria) for THP-1, and 10:1 (cells:bacteria) for A549. These m.o.i ensured the integrity of the infected cell monolayer over a 6-day period. In both these ex vivo models, the numbers of intracellular bacteria (CFU) were determined immediately after phagocytosis and at different time points (as indicated in panels b, e). CFU ratio values (CFU at different time points/CFU at day 0) are reported in c, f. The statistical significance of differences in CFU and CFU ratio values among the strains were determined by one-way Anova with Bonferroni post hoc test. Only the statistical significance of differences between the 79112∆TbD1 mutant and its corresponding control strains (79112 and 79112∆TbD1-C) or H37Rv and its derivative H37Rv::TbD1 and related control Tb36, at days 4 and 6 post infection are depicted in the figure (**P < 0.01; ***P < 0.001). The figure shows the single data points, mean and standard deviations of uptake percentage, CFU numbers and CFU ratio values obtained in a representative experiment performed in quadruplicate (or in triplicate for determination of uptake percentage at m.o.i 1:1).

