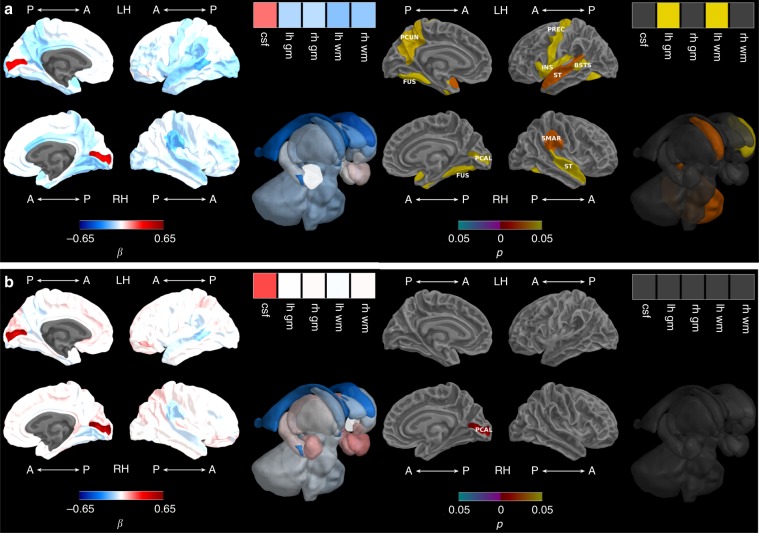
Fig. 2. Brain abnormality and brain growth from term-equivalent to 7 years.
a Before and b after adjusting for total brain volume. Note: Brain abnormality-by-time regression coefficients from linear mixed effects models (β) in blue refer to negative associations (slower growth in children with brain abnormality compared with children with no or mild brain abnormality) and in red refer to positive associations (faster growth in children with brain abnormality compared with children with no or mild brain abnormality), with darker coloured regression coefficients indicating stronger associations; Interaction p values are false discovery rate corrected and darker coloured p values indicate stronger significance; Boxes in the top right corner of the figures represent global brain volumes. A = anterior, P = posterior, LH = left hemisphere, RH = right hemisphere, csf = cerebrospinal fluid, gm = grey matter, wm = white matter, BSTS = banks of superior temporal sulcus, FUS = fusiform, INS = insula, PCAL = pericalcarine, PCUN = precuneus, PREC = precentral, ST = superior temporal, SMAR = supramarginal.

