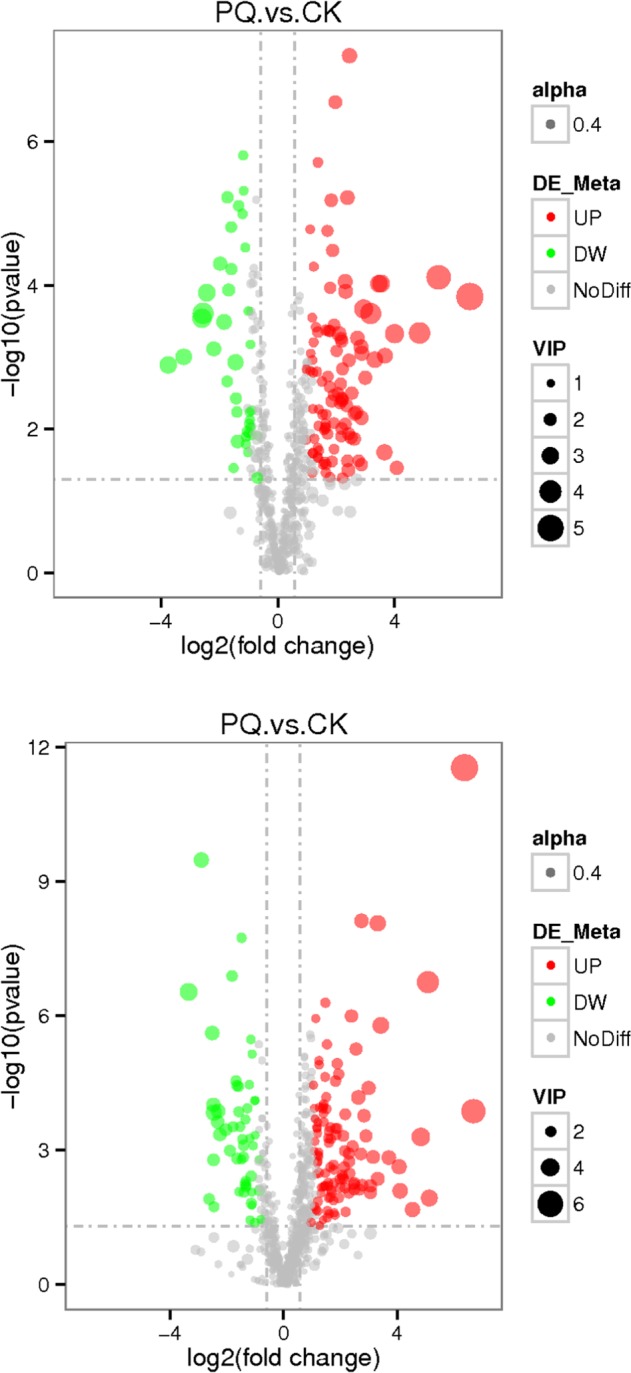
Figure 4.

The volcano plot of the lung metabolomics in mice between the PQ poisoning group and the control group (Red represents the up-regulated metabolites compared with PQ group, green represents the down-regulated metabolites compared with PQ group, and gray represents the metabolites with no difference between the PQ group and the control group. VIP value represents the importance projection value of the metabolite obtained in the PLS-DA model compared in this group. The upper figure was obtained in the negative polarity mode, and the bottom figure was obtained in the positive polarity mode.
