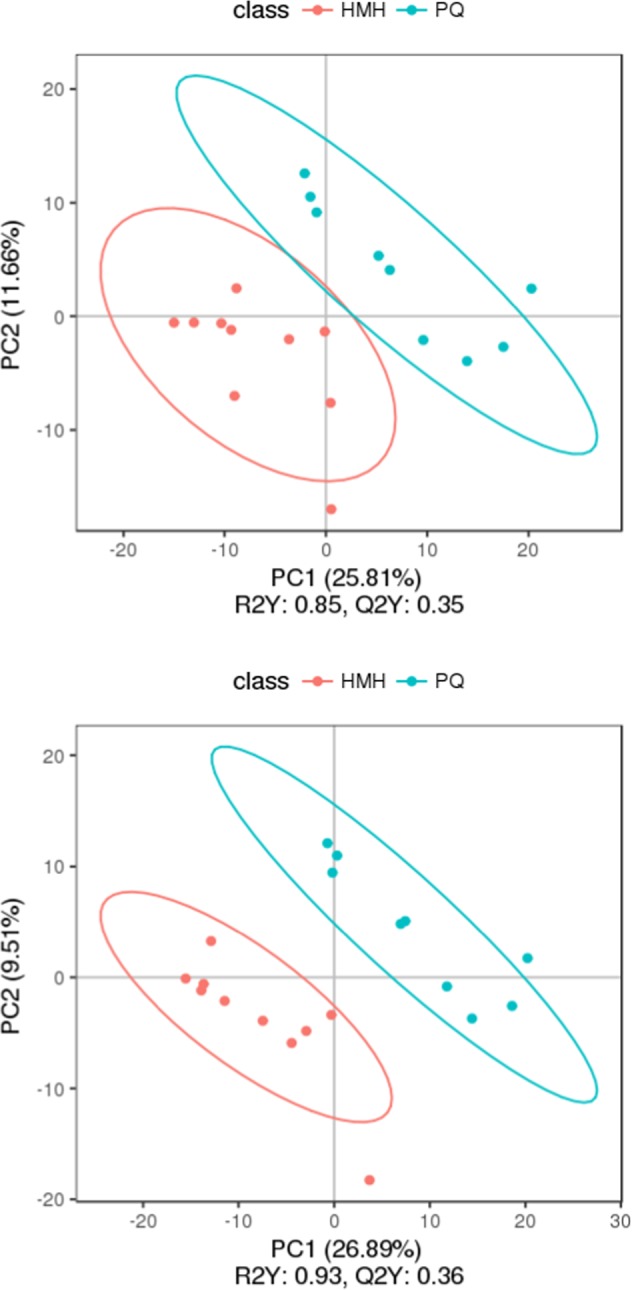
Figure 7.

The PLS-DA, the upper figure was obtained in the negative polarity mode, the bottom figure was obtained in the positive polarity mode. Score plot from partial least squares discriminant analysis of the paraquat group and the HMH group. Each data point represents a function of the entire spectral profile of each subject (n = 19). Partial least squares discriminant analysis showed a clear separation between the 2 groups with acceptable goodness of fit (R2 = 0.85 or 0.93) and predictive power (Q2 = 0.35 or 0.36).
