Figure 9.

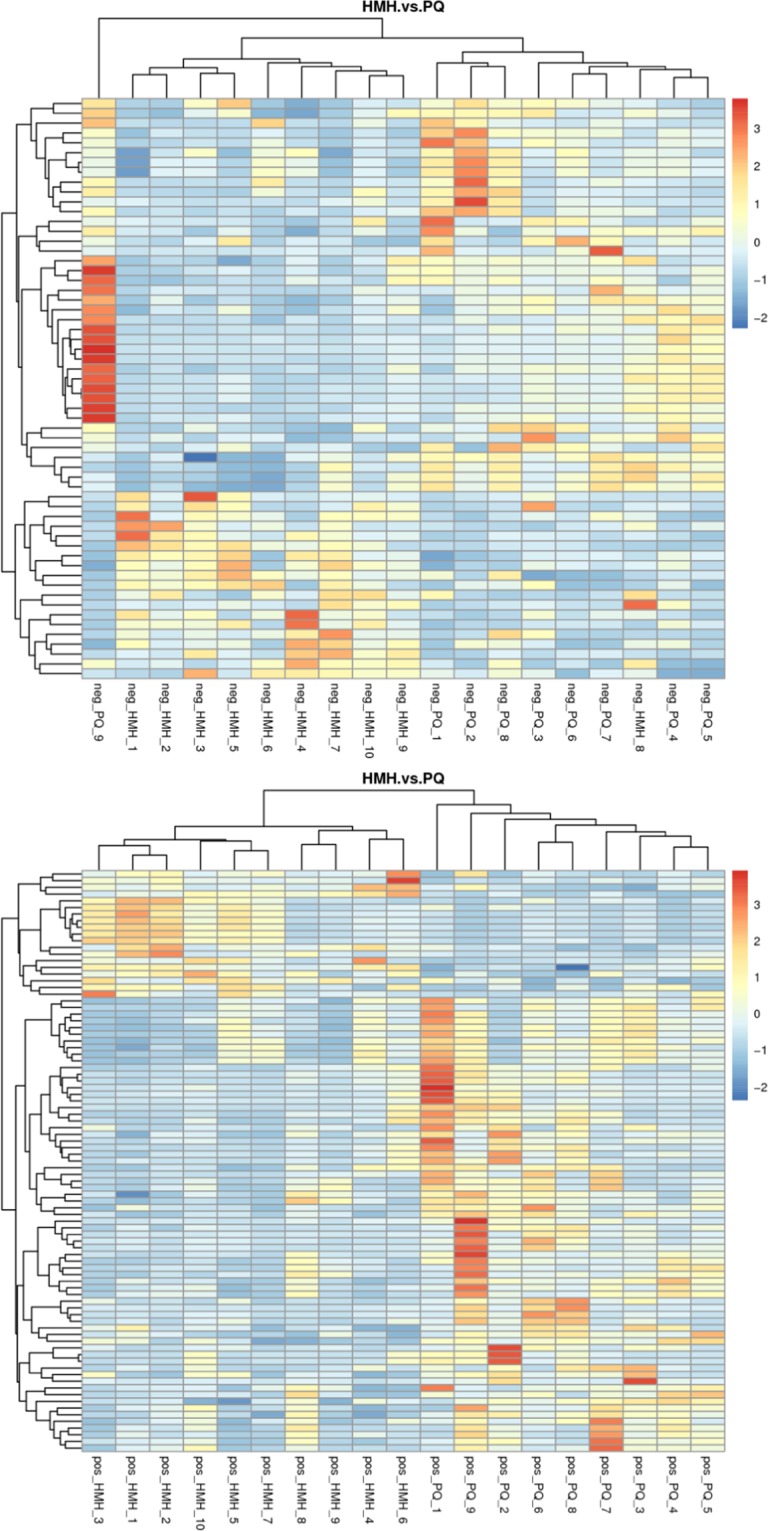
The metabolites heatmap between the HMH group and the PQ group. The upper figure means the metabolites was obtained in the negative polarity mode, the bottom figure means the metabolites was obtained in the positive polarity mode.

The metabolites heatmap between the HMH group and the PQ group. The upper figure means the metabolites was obtained in the negative polarity mode, the bottom figure means the metabolites was obtained in the positive polarity mode.