Fig. 1.
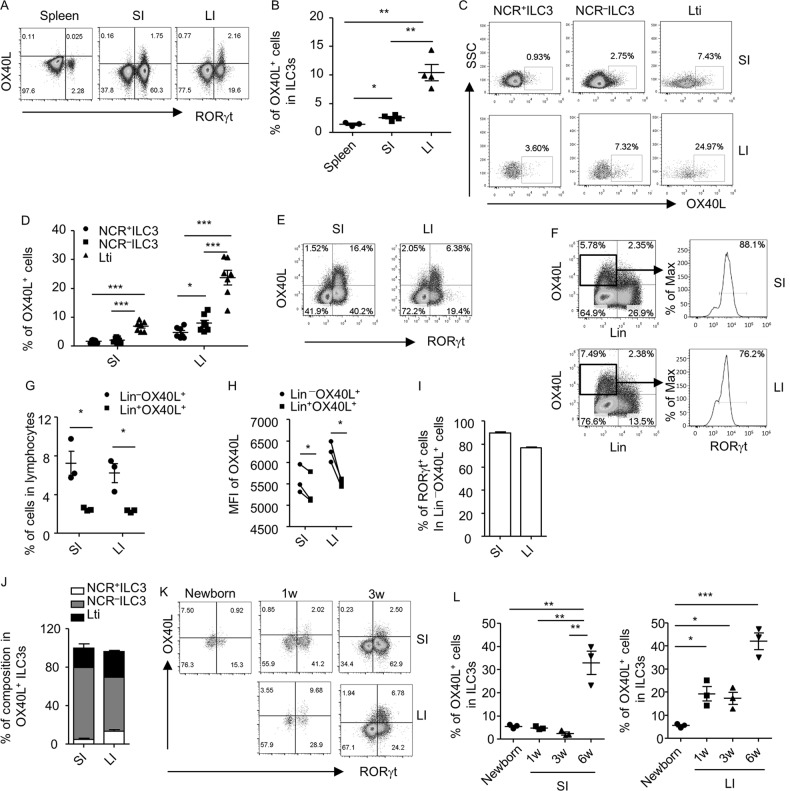
OX40L is highly expressed by intestinal ILC3s of adult mice. Splenocytes and small (SI) and large intestinal (LI) LPLs were isolated from 6-week-old (a–j and l) or young-age (k and l) Rag1–/– mice. Cells were analyzed when freshly isolated (a–d) or after being cultured overnight (e-l). a, e, and k The expression of OX40L and RORγt gated on lineage-negative (Lin–, CD3–B220–CD11b–CD11c–) cells in live lymphocytes was analyzed by flow cytometry. b and l Percentages of OX40L+ cells gated on ILC3s (Lin–RORγt+) are shown. c The expression of OX40L in NCR+ILC3s (Lin–RORγt+NKp46+), NCR–ILC3s (Lin–RORγt+NKp46–CD4–), and Lti cells (Lin–RORγt+NKp46–CD4+) was analyzed by flow cytometry. d Percentages of OX40L+ cells gated on indicated ILC3 subsets are shown. f Expression of Lin and OX40L gated on live lymphocytes was analyzed by flow cytometry. Histogram of RORγt expression gated on Lin–OX40L+ cells is shown. g Percentages of Lin–OX40L+ (upper left quadrant in (f)) and Lin+OX40L+ cells (upper right quadrant in (f)) gated on live lymphocytes are shown. h MFI of OX40L of Lin–OX40L+ and Lin+OX40L+ cells in (f) is shown, respectively. Connected dots were paired data from biological repeats. Statistical analysis was performed with paired t test. i Percentages of RORγt+ cells in Lin–OX40L+ cells in (f) are shown. j Percentages of the composition of different ILC3 subsets within OX40+ILC3s are shown. a–l Data are representative of three independent experiments. LPLs, lamina propria lymphocytes; MFI, mean fluorescence intensity

