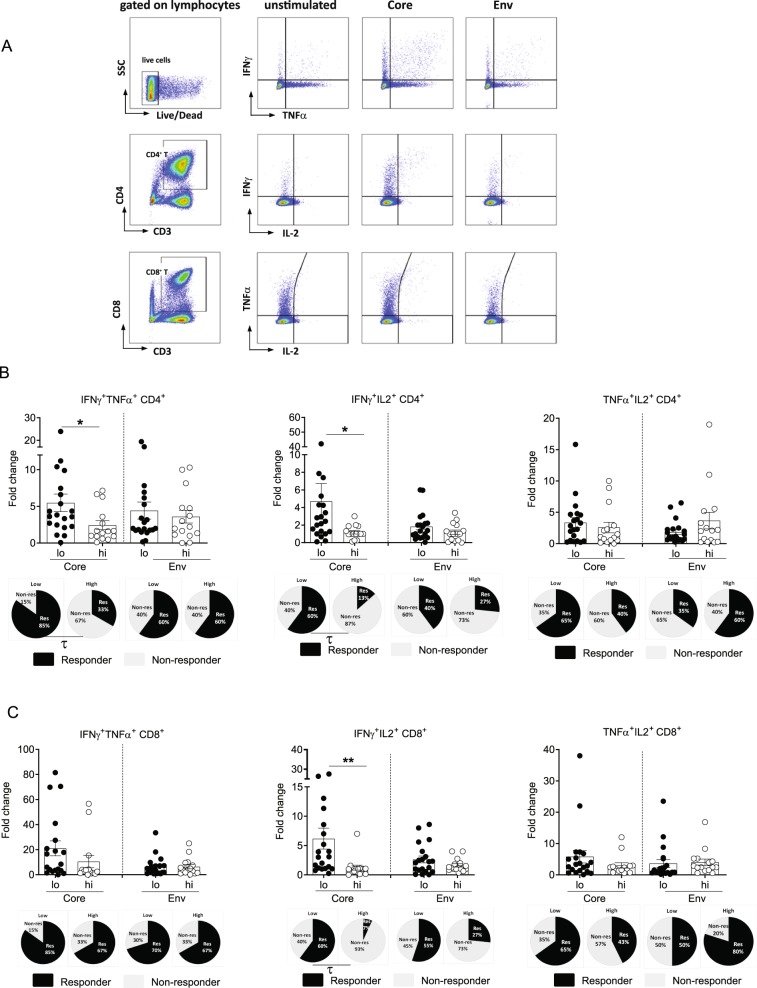
Figure 3.
Flow cytometric analysis of HBV-specific CD4+ and CD8+ T cell responses between the HBslo (designated as lo) and HBshi (designated as hi) groups. (A) Gating strategies for intracellular cytokines IFNγ, TNFα and IL2 expression in CD4+ and CD8+ T cells. (B) Fold change in the frequency of CD4+ T cells or (C) CD8+ T cells secreting dual cytokines (IFNγ+TNFα+, IFNγ+IL2+ or TNFα+IL2+) following stimulation with HBcAg (Core) or HBsAg (Env) pooled peptides. Data were presented as fold change with respect to unstimulated control for individual samples. Each data point represents 1 sample and horizontal line represents the median value. Pi-charts represent the proportion of patients ≥2-fold change (Responder, Dark shade) and those <-fold change (Non-responder, light shade) in the measured parameters. Unpaired t test or Mann-Whitney U test were performed for parametric or non-parametric data respectively. *p < 0.05, **p < 0.005. χ2-test were performed to assess an association between serum HBsAg level and fold changes to HBV peptide stimulation. τ; p < 0.05 in χ2-test.

