Figure 5.
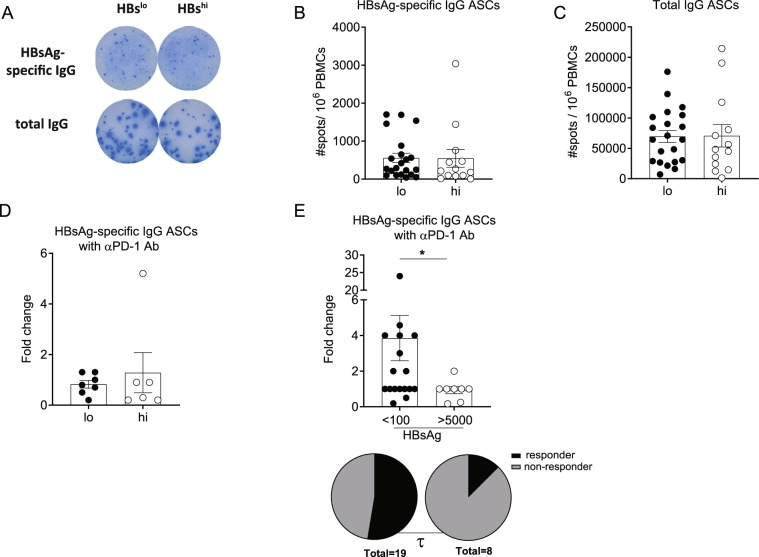
Analysis of HBsAg-specific B cell responses by HBsAg-specific ELISpot assay. PBMCs were stimulated with R848 and rIL-2 for 5 days and HBsAg-specific IgG as well as total IgG antibody-secreting cells (ASCs) were assessed by HBsAg-specific ELISpot assay. (A) Representative ELISpot image for HBsAg-specific or total IgG ASCs from the HBslo (designated as lo) or HBshi (designated as hi) patients. Number of (B) HBsAg-specific IgG and (C) total IgG ASCs per 106 PBMCs from the HBslo (n = 21) and HBshi (n = 13) groups. (D) Fold change of HBsAg-specific IgG ASCs by R848 + αPD-1 antibody with respect to R848 stimulation alone, between the HBslo and HBshi groups. (E) Fold change of HBsAg-specific IgG ASCs by CpG-B + αPD-1 with respect to CpG-B stimulation alone, between patients with HBsAg < 100 IU/ml and HBsAg > 5,000 IU/ml by ELISpot assay. Pi-charts represent the proportion of patients ≥ 2-fold change (Responder, Dark) and those <-2-fold change (non-responder) between 2 groups. Each data point represents 1 sample and horizontal line represents the median value. Mann-Whitney U test were performed for statistical analysis. *p <0.05. χ2-test were performed to assess an association between serum HBsAg level and fold changes to αPD-1 antibody. τ; p < 0.05 in χ2-test.

