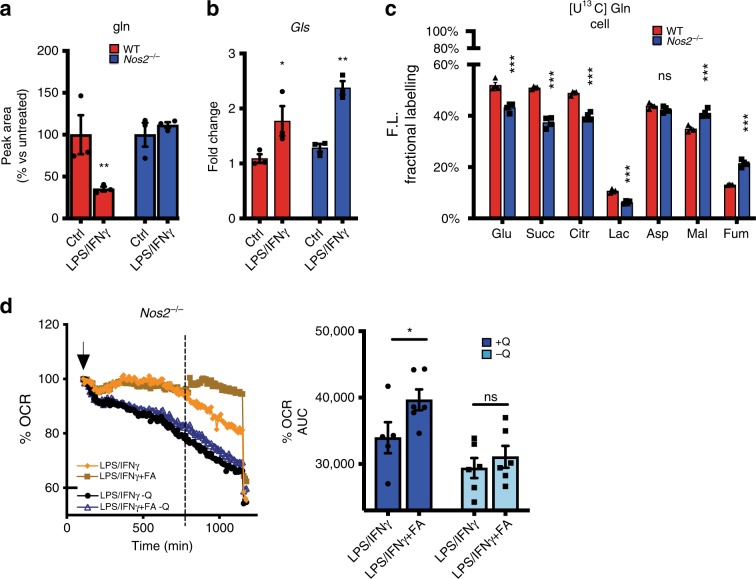
Fig. 5. LPS/IFNγ increase glutamine utilization in NO-dependent manner.
a Extracellular glutamine levels were quantified by GC-MS in O.N. stimulated WT vs. Nos2−/−. Data (n = 9) were normalized to the absolute peak area of the metabolite in WT control and were analyzed by two-way ANOVA (interaction p = 0.0037) (Sidak’s post-tests). b RNA as in 2a were analyzed for Gls expression (two-way ANOVA with Sidak’s post-tests, p-values = 0.0114, 0.0024). c Fractional contribution of 13C-labeling from [U-13C] Glutamine in metabolites of the TCA in activated WT vs. Nos2−/− BMDMs Data (n = 4) were analyzed by two-way ANOVA (interaction < 0.0001) (Sidak’s post-tests). d OCR in Nos2−/− BMDMs after addition of LPS + IFNγ (at the arrow indicated) in the presence or absence of glutamine (Q). Bar graphs showing quantification of OCR after addition of FA compared to vehicle (dotted line). Data (n = 3) were analyzed by two-way ANOVA (interaction p = 0.0192) (Sidak’s post-tests). All error bars display mean ± SEM. Source data are provided as a Source Data file.

