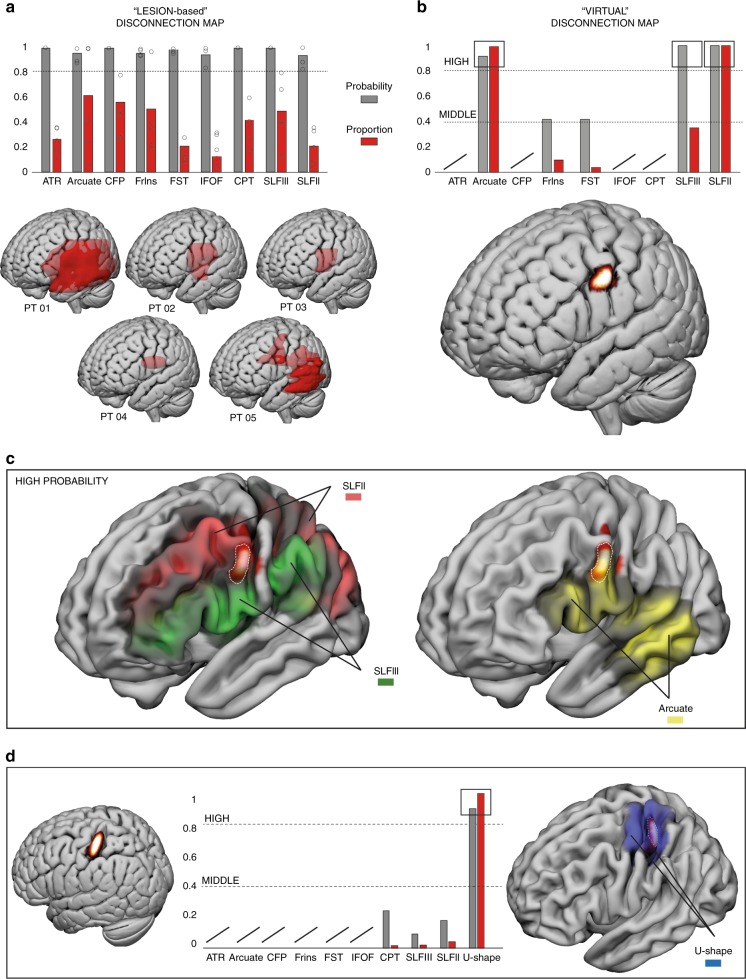
Fig. 4. Disconnection results.
Results for the lesion-based (a) and virtual-lesion (b) disconnection analysis. In the bar graphs we showed the probability (gray) and the voxels proportion (red) of the tracts disconnected in all five AHP patients with a minimum probability of 80%. Below the bar graphs the lesion of the five AHP patients (a) (each circle-dot corresponds to patient probability for each tract) and the probability density estimation from which we extracted the virtual-lesion volume (b). Both are plotted on the ICBM152. c Anatomical relationship between the PMC virtual lesion and the SLF II–III and the arcuate plotted onto the smoothed ICBM152. d Anatomical relationship between the S1 virtual lesion and U-Shape fibers connecting postcentral and precentral gyrus.

