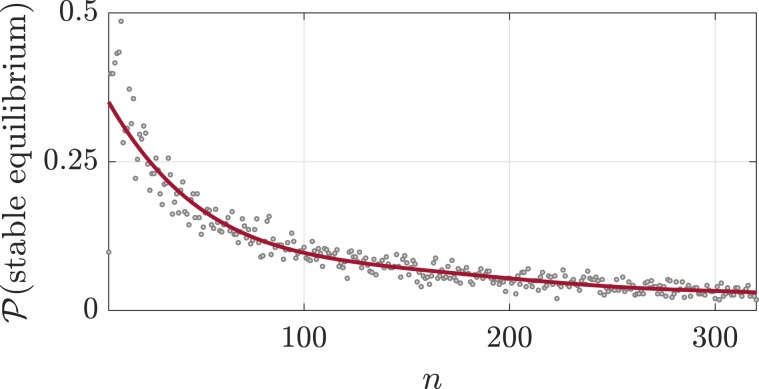
Figure 1.
This figure shows the probability that an ecological network is stable as a function of the network dimension. Each point in the plot represents the percentage of stable networks with given dimension (n), over a sample of 500 mutualistic ecological networks47 with randomly chosen small-world topology. As can be seen, the percentage of stable networks decreases to zero as the network cardinality increases. This suggests that ecological networks with increasing size are likely unstable or fragile, so that small parameter variations lead to unstable evolutions.

