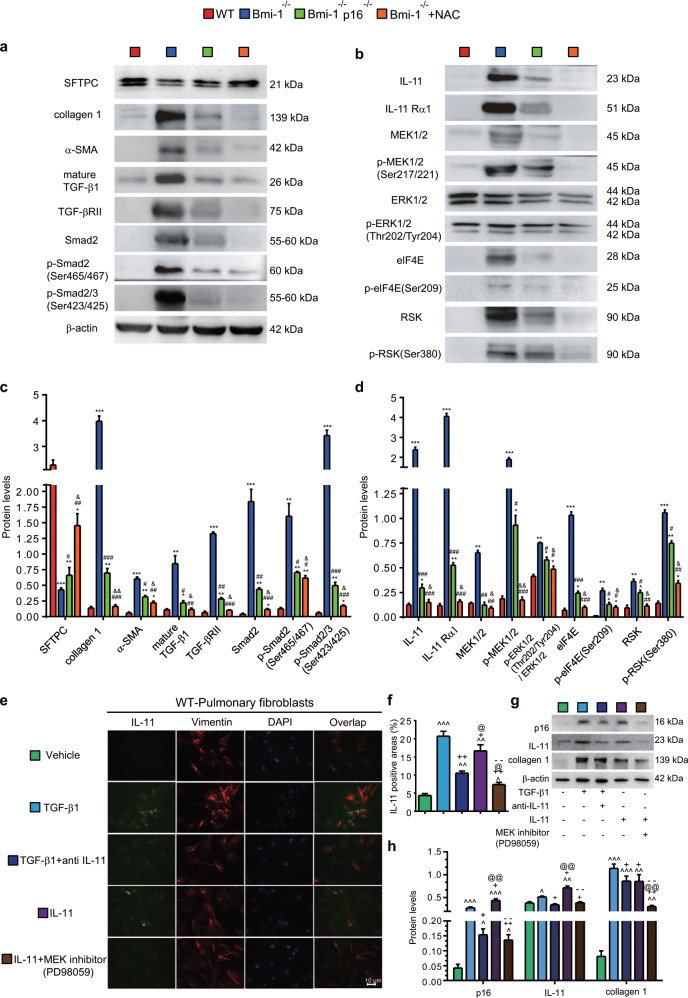
Fig. 4. NAC treatment inhibited TIME signaling in Bmi-1−/− mice more than in Bmi-1−/−p16−/− mice.
Western blots of pulmonary extracts showing a SFTPC, collagen 1, α-SMA, mature TGF-β1, TGF-βRII, Smad2, pSmad2 (Ser465/467), pSmad2/3 (Ser423/425); b IL-11, IL-11Rα1, MEK1/2, pMEK1/2(Ser217/221), ERK1/2, pERK1/2(Thr202/Tyr204), elF4E, p-elF4E(Ser209), RSK, and p-RSK(Ser380). c, d Protein expression relative to β-actin (graph a) was assessed by densitometric analysis. Six mice per group were used for experiments. Values are the means ± SEM of six determinations. *P < 0.05, **P < 0.01, ***P < 0.001 compared with the WT group; #P < 0.05, ##P < 0.01, ###P < 0.001 compared with the Bmi-1−/− group; &P < 0.05, &&P < 0.01 compared with the Bmi-1−/−p16−/− group. e Pulmonary fibroblasts from 7-week-old WT mice treated with TGF-β1 (5 ng/ml, 48 h), TGF-β1 (5 ng/ml, 48 h) and anti-IL-11 antibody (2 μg/ml, 48 h), IL-11 (5 ng/ml, 48 h), or IL-11 (5 ng/ml, 48 h) and the MEK inhibitor (PD98059) (10 μm, 48 h). Representative micrographs immunofluorescently labeled for IL-11 and vimentin, with DAPI staining the nuclei. f Percentage of IL-11-positive areas relative to the total. g Western blots showing p16, IL-11, and collagen 1. β-actin was used as the loading control. h Protein expression relative to β-actin was assessed by densitometric analysis. Six biological replicates were used per experiment. Values are the means ± SEM of six determinations. ^P < 0.05, ^^P < 0.01, ^^^P < 0.001 compared with the vehicle group; +P < 0.05, ++P < 0.01 compared with the TGF-β1 group; @P < 0.05, @@P < 0.01 compared with the TGF-β1 and anti-IL-11 group; −−P < 0.01 compared with the IL-11 group.

