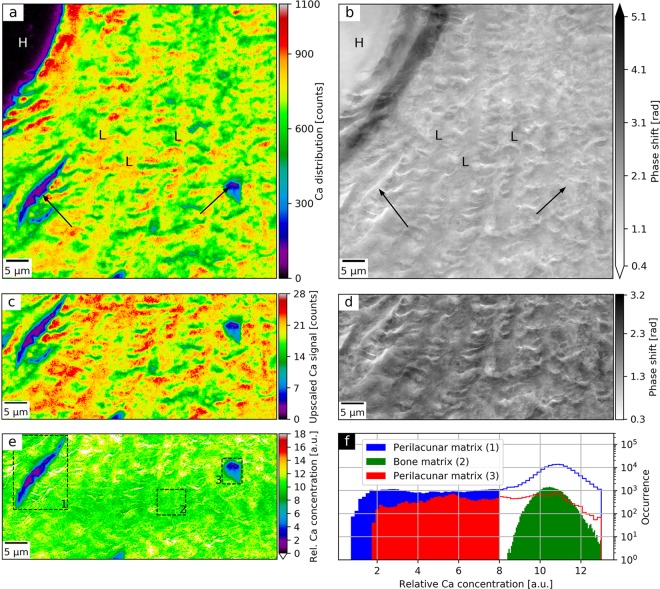
Figure 3.
Spatial distribution of relative Ca concentration of a human bone section using simultaneous ptychography and X-ray fluorescence (XRF) at 7.15 keV. (a) shows the Ca distribution as obtained by XRF mapping and (b) the ptychographic phase shift. Both (a,b) allow to identify a Haversian canal (H) and concentric lamellae (L). In (a), the Ca depletion areas (black arrows) indicate perilacunar matrices of two osteocyte lacunae, while the corresponding areas in (b) exhibit no change in phase shift, which is proportional to the projected density. The lower half of the Ca map was bilinearly upscaled (c) and divided by the regularized ptychographic phase (d). (e) presents the mass-thickness-corrected Ca map corresponding to the relative Ca concentration. Sample preparation artefacts were masked in white. (f) shows histograms of relative Ca concentrations values of three bone matrix areas as marked with dashed rectangles in (e). It compares relative Ca concentrations between two regions enclosing the identified perilacunar matrices (1, 3) and a representative region of the bone matrix (2). Face-filled in blue and red histogram values correspond to actual areas of the perilacunar matrices and span over visibly lower range of relative Ca concentrations than the values from the bone matrix (in green).

