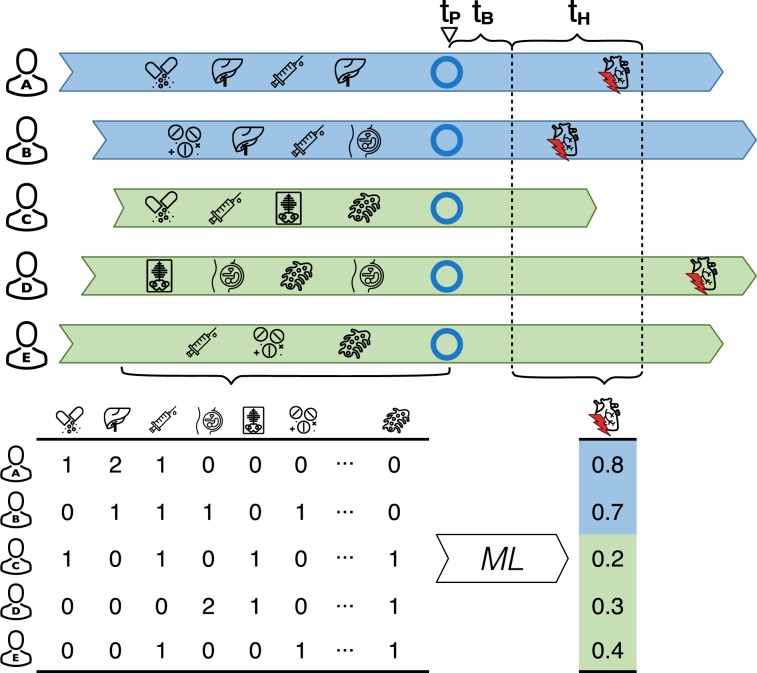
Figure 1.
The colored arrows represent each individual’s accumulated history of register events (determinants, used as predictive features). tp represents the date of prediction (in this case the day of the first T2D diagnosis represented by blue circles). tB depicts the buffer period of 30 days used to exclude individuals who were diagnosed with the comorbidity shortly before tP. tH represents the five-year prediction horizon. Individuals for whom the comorbidity occurred before the prediction horizon were removed. Individuals with their first comorbidity diagnosis occurring within the prediction horizon are referred to as cases and all others are referred to as non-cases. For each individual, register features representing medical events which occurred before the time of prediction are aggregated into counts (table below) and used as the prediction model’s predictor variables (features) to determine the likelihoods of being a case or a non-case. ML, machine learning.

