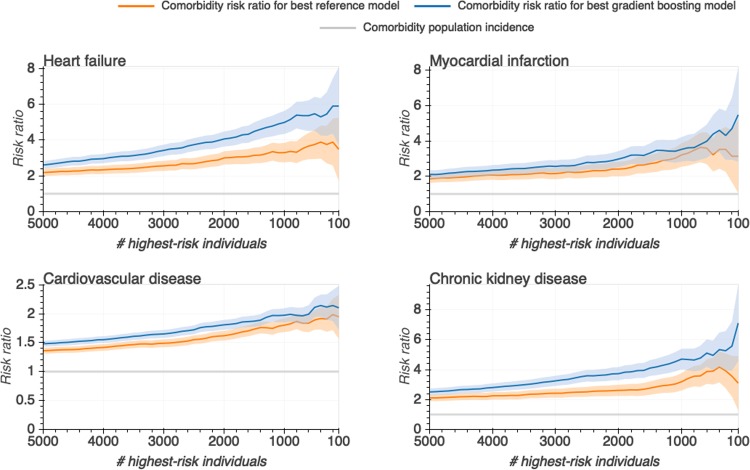
Figure 4.
For each comorbidity individuals were ranked according to their predicted risk by the gradient boosting (blue) and reference (orange) models. For a number of individuals predicted to have the highest risk, risk ratios were calculated as the comorbidity incidence of individuals ranking above that threshold over the comorbidity incidence in the entire study population. 95% confidence intervals (shaded areas) were obtained through bootstrap sampling.

