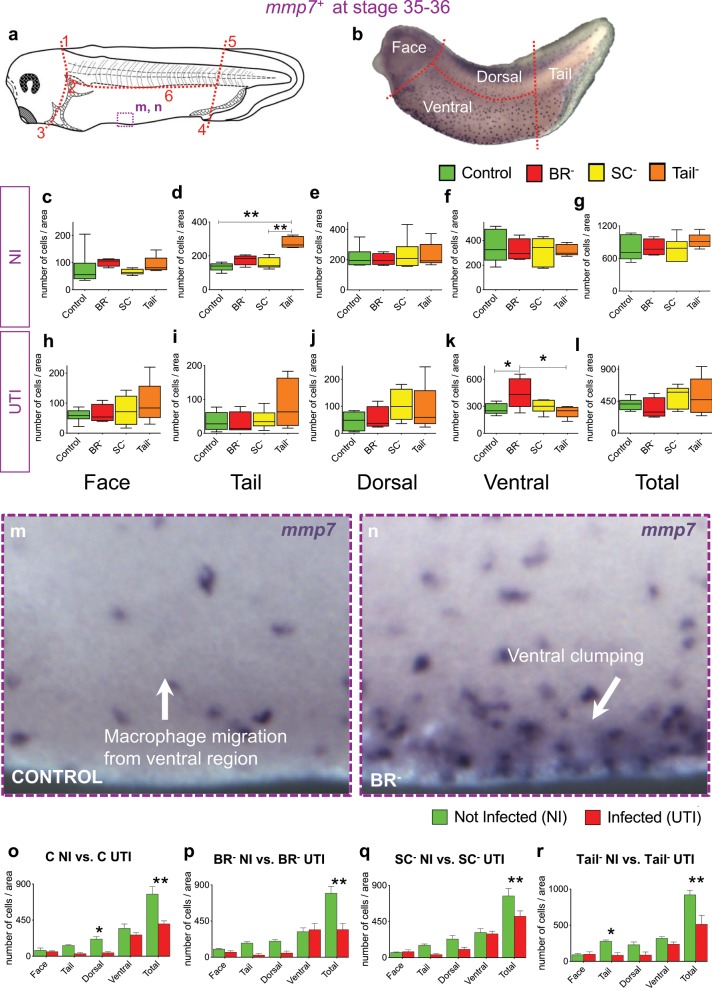
Fig. 3. The absence of the brain during development affects the migration of macrophages in response to infection.
a, b Drawing of (a) and image after in situ hybridization (ISH) for mmp7+ (b) of one st. 35 Xenopus embryo indicating the landmarks or reference points (1–6) for the body subdivision in the four independent areas for quantification (see Methods for details). Dashed-purple line square indicates the area shown in m, n inserts. Rostral is left and dorsal is up. c–l Quantification of number of mmp7+ cells in not-infected (NI, c–g) and infected (UTI, h–l), belonging each experimental group: Control (Ctrl, green), brainless (BR–; red), spinal cord resection (SC–; yellow) and Tailless (Tail–; orange). Values for normalized number of mmp7+ cells are plotted per each region and group: face (c, h), tail (d, i), dorsal (e, j), and ventral (f, k) to detect distribution and migration patterns. Total (g, l) is the sum of the four regions. One-way ANOVA P value showed significance for (d) (P < 0.01) and (k) (P < 0.05). m, n High-magnification images showing detail of ventral region (purple square in (a)) with mmp7-positive cells in a Control (m) vs. Brainless (n) embryos. VBI: Ventral Blood Islands or primitive hematopoietic organ. o–r Number of mmp7-positive myeloid cells (normalized to the area) in not-infected (green) vs. infected (red) embryos belonging Ctrl (o), BR– (p), SC– (q), and Tail– (r) groups. Counts were done on four independent regions of the whole animal body (plus the summation): face, tail, dorsal and ventral areas. Two-way ANOVA showed significant P values for all comparisons (P < 0.05). c–l, o–r Data represent the mean and S.D. of, at least, ten different embryos, from three different replicates, per each group and condition. Significant P values after post hoc Bonferroni test are indicated as *P < 0.05 and **P < 0.01. See also Supplementary Fig. S2.

